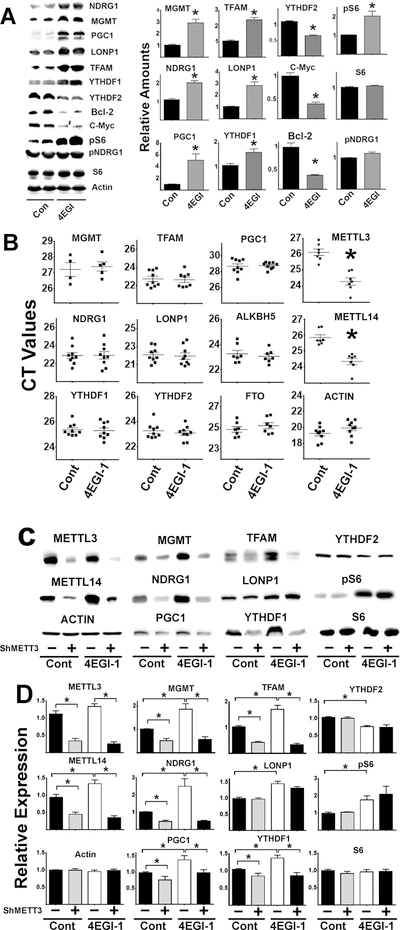
Figure 6. Effects of 4EGI-1 and downregulation of the METTL3/14 in HEK CIT proteins.
A) Representative western blots from two mice per group showing the effects of 4EGI-1 treatments on CIT protein expression; bars represent the mean ± S.E.M.SEM from, at least, 4 independent experiments. All values were normalized to the respective controls. B) CT values of qRT-PCR performed in mRNA purified from at least four 4EGI-1/controls treatments per group for MGMT and additional, at least, six 4EGI-1 treatments/controls for the other mRNAs tested. C) Representative western blot analysis of downregulation of METTL3/14 by shRNAMETTL3 followed by 4EGI-1 treatments. D) Graph bars represent the mean ± S.E.M. SEM from at least 4 independent experiments. All values were normalized to the respective controls. The (*) indicates statistical significance (p<0.05) relative to controls.

