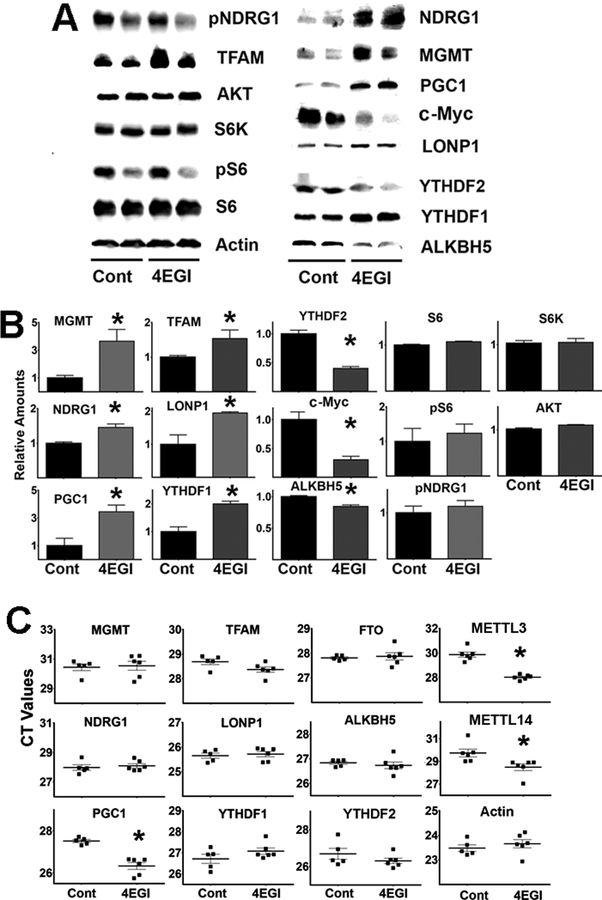
Figure 9. 4EGI-1 treatments can upregulate the expression of proteins associated with the m6A pathway in mouse liver.
A) Representative western blot analysis of 4EGI-1 treatments in liver. B) Bar graph with the mean ± S.E.M. from at least four control mice and nine 4EGI-1 treated mice per group. All values were normalized to the respective controls. The (*) indicates statistical significance (p<0.05) relative to controls. C) CT values of qRT-PCR performed in mRNA purified from samples shown in panel B.

