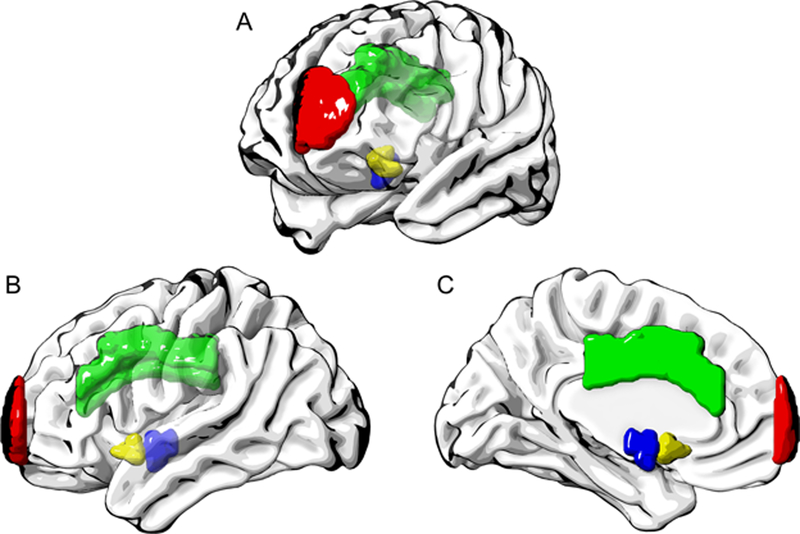
Fig. 3:
Region of interests associated with less oral intake improvement after controlling for age, CCI and LOS in multivariable linear regression modelling. A = oblique view; B = left hemisphere, lateral; C = left hemisphere, medial; red = left superior frontal gyrus (frontal pole); green = left dorsal anterior cingulate gyrus; blue = left hypothalamus; yellow = left nucleus accumbens.

