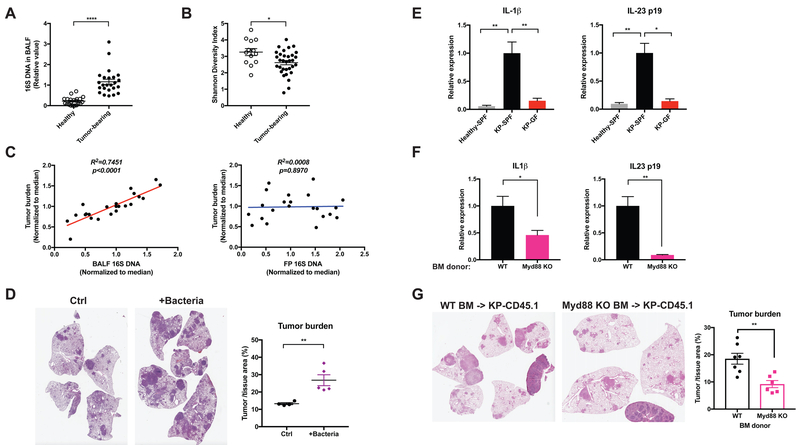
Figure 2. Lung tumor development is associated with altered local microbiota and increased pro-inflammatory cytokine expression.
(A, B) BALF samples were collected from tumor-bearing lungs from KP mice or healthy controls. Data were pooled from 5 independent cohorts.
(A) Total bacterial burden in BALF determined by 16S rDNA based qPCR analysis. Data were normalized to the corresponding median value of the tumor-bearing samples in each cohort.
(B) Shannon diversity index of the bacterial communities present in BALF.
(C) Linear regression curves illustrating the correlation between tumor burden and bacterial load in BALF or fecal pellet (FP) samples. Bacterial load in fecal pellets and BALF from untreated and antibiotic-treated SPF KP mice was measured by 16S rDNA-based qPCR; tumor burden was quantified at 15 weeks post tumor initiation. Data were normalized to the corresponding median value of each cohort, and the plots represent pooled data from 3 experimental cohorts.
(D) KP mice were infected with a lower dose of Sftpc-Cre adenovirus than the other experiments. 3.5 weeks post tumor initiation, they were left untreated as controls (Ctrl) or intratracheally inoculated with a consortium of bacteria that were isolated and cultured from late-stage lung tumors in a separate cohort of SPF mice (+Bacteria, see Experimental Model and Subject Details). Tumor burden was analyzed 8 weeks following inoculation; representative H&E pictures and quantifications are shown. n= 5 mice/group.
(E) RT-qPCR analysis of IL-1β and IL-23 p19 mRNA expression in the lung tissues from healthy SPF mice, tumor-bearing SPF mice and tumor-bearing GF mice.
(F) KP mice on the CD45.1 background were lethally irradiated and reconstituted with bone marrow from either wild-type (WT) or Myd88-deficient donors. Expression of IL-1β and IL-23 p19 mRNA were analyzed in FACS-purified alveolar macrophages and neutrophils respectively. Tumor burden was quantified 15 weeks post tumor initiation and representative H&E pictures are shown.
Results are expressed as the mean ± SEM. *p<0.05, ** p<0.01, **** p<0.0001 by Student’s t test. For each experiment, n= 6–7 mice/group; data represent 3 independent experiments. See also Figure S2.

