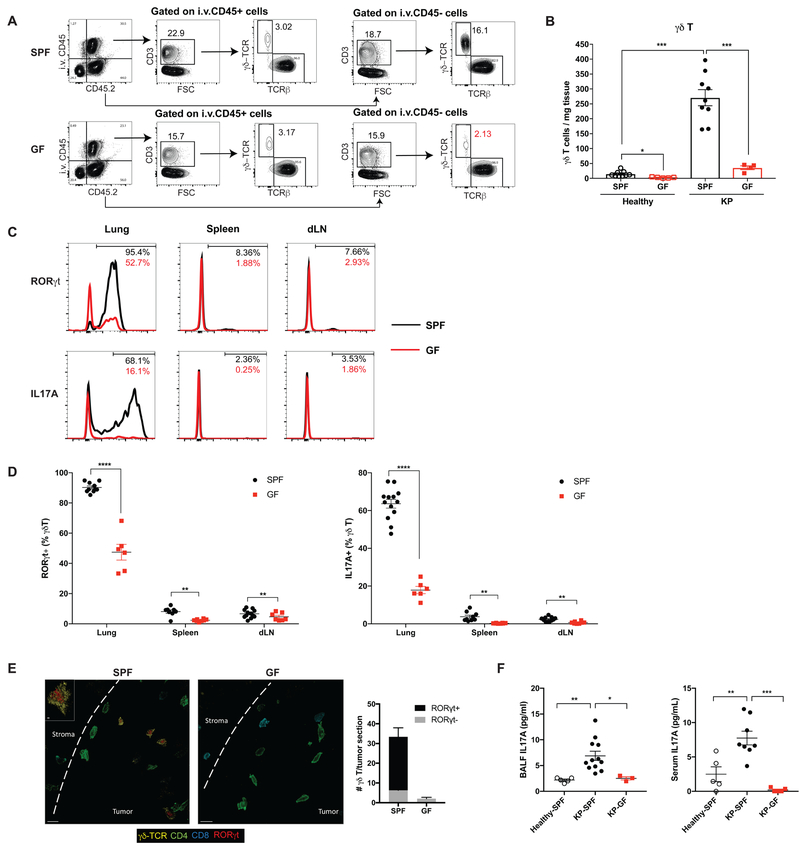
Figure 3. Microbiota are required for the expansion of γδ T17 cells associated with tumor development.
(A, B) Flow cytometry analysis of γδ T cells in the tumor-bearing lungs from SPF and GF mice. Samples were first gated on total live cells, then gated on the immune cell compartments in the circulation (positive for intravascular CD45 labeling, i.v.CD45+) and in the lung tissue (i.v. CD45−) separately with subsequent gating on CD3+ lymphocytes. The numbers of γδ T cells in the lung tissue (i.v. CD45−) are calculated (A) and representative plots are shown (B).
(C, D) RORγt and IL-17A expression in γδ T cells from the tumor-bearing lung, spleen and draining lymph node examined by flow cytometry and compared between SPF mice (black) and GF mice (red). Representative histograms are shown (C) and the frequencies of RORγt+ or IL-17A+ γδ T cells are quantified (D).
(E) Confocal immunofluorescent images of tumor-bearing lungs from SPF and GF mice with quantification. Yellow: γδ-TCR; Red: RORγt; Green: CD4; Aqua: CD8; dashed line: tumor border. Scale bar =10 μm. Inset: optical slice of γδ T cells with RORγt expression (z-depth different than larger image), scale bar = 2 μm.
(F) IL-17A levels in BALF and serum samples collected from healthy SPF mice, tumor-bearing SPF mice and tumor-bearing GF mice as measured by ELISA.
Results are expressed as the mean ± SEM. *p<0.05, ** p<0.01, *** p<0.001, **** p<0.0001 by Student’s t test. For each experiment, n= 6–12 mice/group; data represent at least 4 independent experiments. See also Figure S3.

