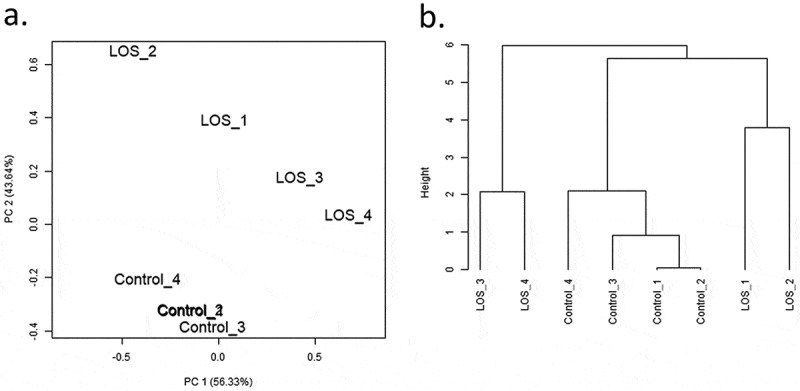
Figure 1.

Principal component analyses (PCA) and hierarchical clustering of miRNAs detected in bovine muscle samples of control and LOS groups. (a) The PCA plot illustrates the variance of miRNA expression within or between groups through two principal components – the first (PC1, x-axis) and second (PC2, y-axis) principal component. PC1 explains ~56% of the variance, and PC2 explains ~44% of the variance. (b) The dendrogram shows the hierarchical clusters of bovine control and LOS libraries. Height represents the closeness between individual samples or clusters by measuring the correlations. Results of kidney, liver, and tongue refer to Supplementary Figure S1B.
