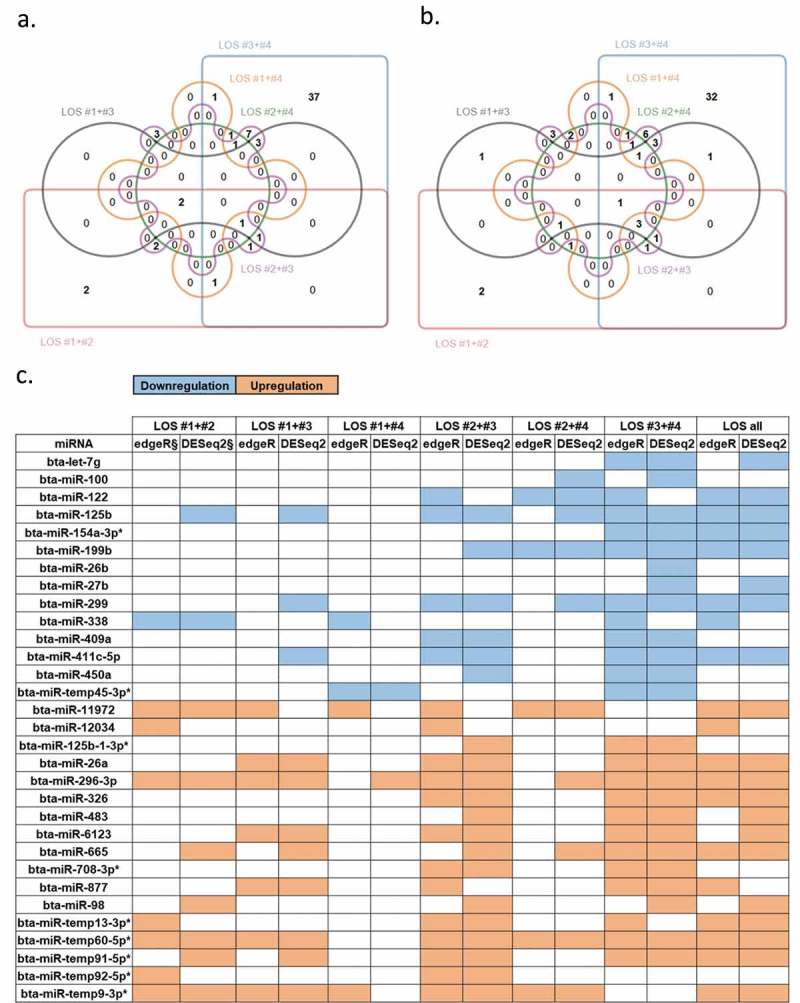
Figure 2.

Differentially expressed miRNAs (DE-miRNAs) in muscle of LOS foetuses when compared with controls. (a) The Edwards’ Venn diagram shows the number of DE-miRNAs detected by edgeR package. Different colours/shapes represent different two-LOS combinations. Numbers within unique or overlapped regions indicate numbers of DE-miRNA shared by one or multiple combinations. (b) Same as (a) but shows the results of DESeq2 package. (c) An example of DE-miRNAs detected by various combinations and methods (complete summary table of muscle refers to Supplementary Figure S2A). Leftmost column shows the name of the DE-miRNAs. Space filled with colour indicate that miRNA was detected as significant in the corresponding combination and method. § = FDR < 0.05 for edgeR or padj < 0.05 for DESeq2. Blue = downregulation. Orange = upregulation. * = putative miRNAs. Kidney, liver, and tongue results refer to Supplementary Figure S2B, S2C, and S2D, respectively.
