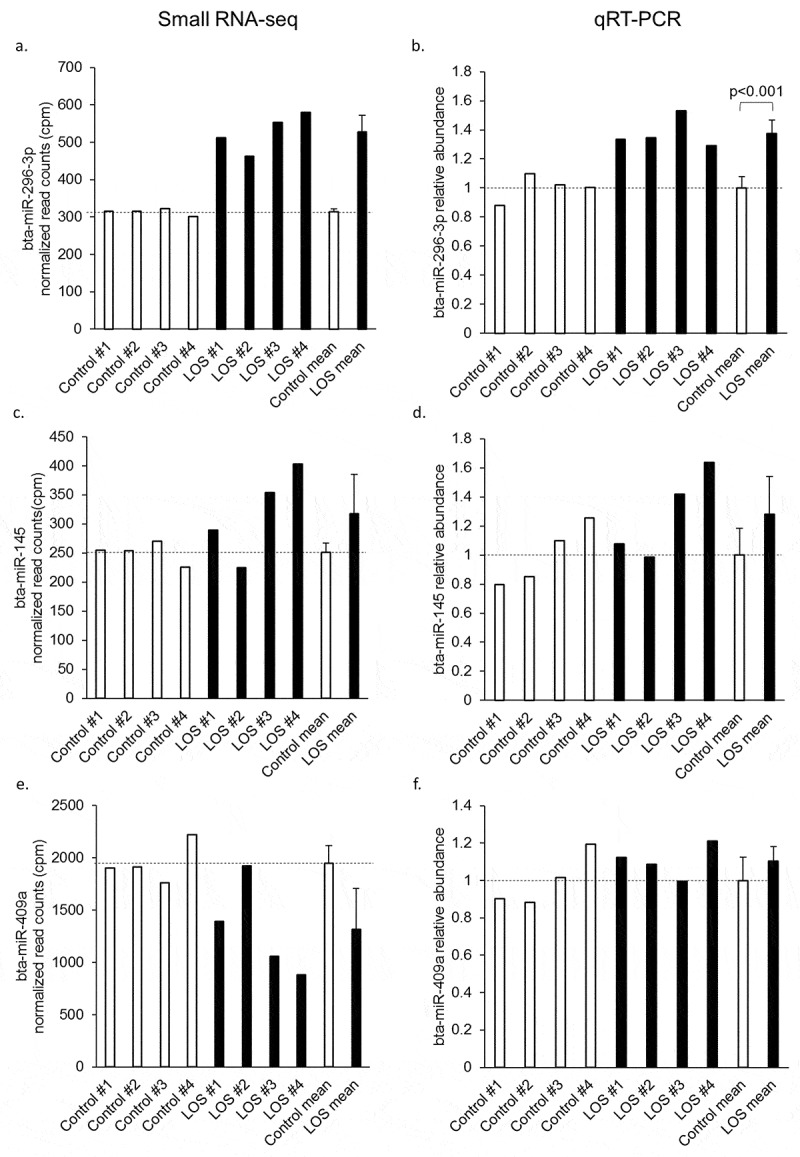
Figure 5.

qRT-PCR validation of differentially expressed miRNAs (DE-miRNAs) in bovine muscle. Normalized read counts from small RNA-seq results for each DE-miRNA tested are shown in panels a, c, and e and the corresponding qRT-PCR results are shown in b, d, and f. The normalized read counts were acquired from all control vs. all LOS comparisons after all the normalization steps were done. For qRT-PCR results, the level of each DE-miRNAs was normalized to the geometric mean of four selected endogenous control miRNAs. Student’s t tests were performed for qRT-PCR results and significant difference between control and LOS groups was indicated by p value. Dashed lines = control means. Unfilled bars = control muscle samples. Filled bars = LOS muscle samples. The mean and standard deviation of the groups are shown at the right of each panel. Sequencing results of bta-miR-409a were not confirmed by qRT-PCR. Results for the other three DE-miRNAs may be found in Supplementary Figure S3A.
