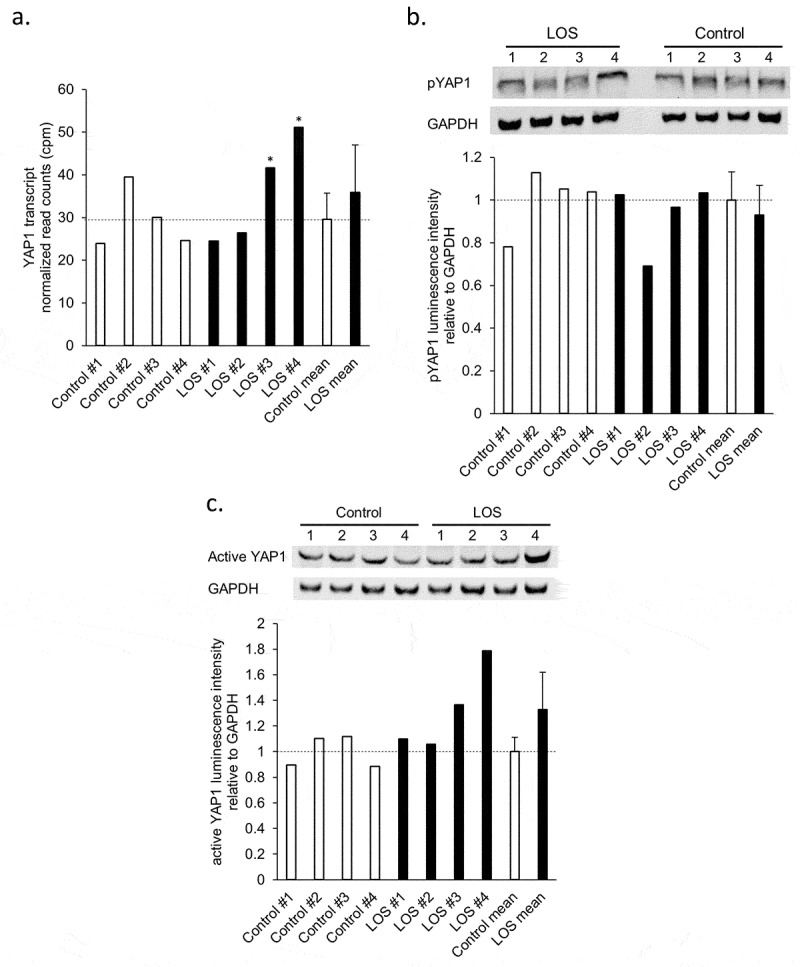
Figure 7.

YAP1 transcript and protein abundance in bovine muscle samples of control and LOS foetuses. (a) Normalized read counts of YAP1 transcript were acquired from previous studies (* = FDR < 0.05 [27];). (b) and (c) Upper panel: Western blotting results of phosphorylated (inactive) YAP1 protein (b) or active YAP1 protein (c) with GAPDH as endogenous control. pYAP1 = phosphorylated YAP1. Lower panel: Relative luminescent signal intensity of pYAP1 or active YAP1 to GAPDH measured from the pictures of the membrane. Dashed lines = control means. Unfilled bars = control muscle samples. Filled bars = LOS muscle samples. The mean and standard deviation of the groups are shown at the right of each panel.
