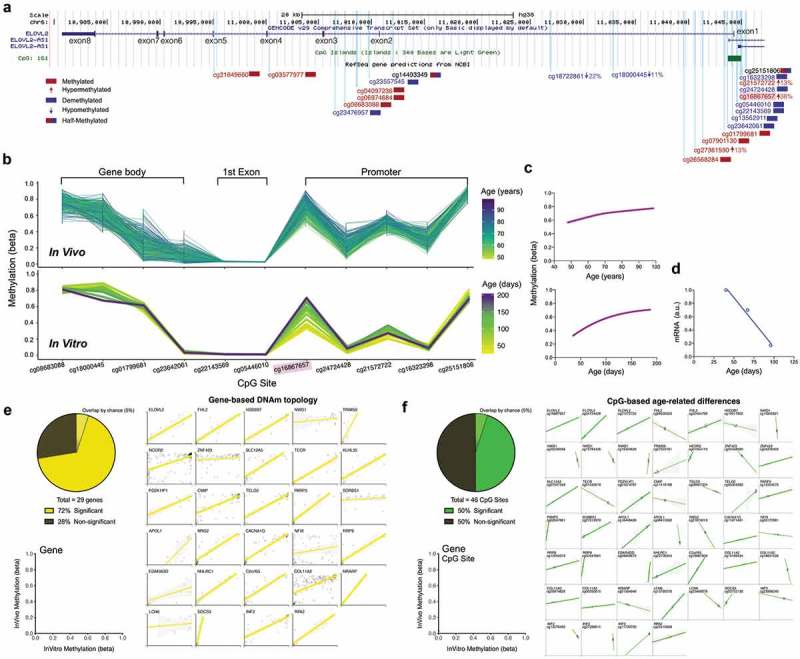
Figure 3.

ELOVL2 DNAm topology and age-related hypermethylation and expression are conserved between human blood and cultured fibroblasts.
(a) Overview of the ELOVL2 gene with 8 exons, 7 introns, and 1 CpG Island (green box) located in the promoter region. All EPIC array CpG sites are mapped as vertical light-blue lines. CpGs with >75% (red) or <25% (blue) methylation levels are color coded, and CpGs exhibiting significant DNAm changes in human blood across the cellular lifespan are indicated by an arrow with their % change in DNAm level. (b) DNAm topology graph of ELOVL2 CpG sites within the promoter, first exon, and gene body present in both the EPIC (in vitro, fibroblasts) and 450k (in vivo, blood) arrays. Methylation levels from whole blood [top,, 6] and cultured human fibroblasts (bottom) are juxtaposed, highlighting their similar topology. In both datasets, each line represents a different individual (in vivo) or timepoint of the same individual’s cells (in vitro), color-coded by age. (c) Sigmoidal fit line of the DNAm levels for cg1686657 in vivo (top) and in vitro (bottom) across the lifespan. (d) ELOVL2 transcript levels quantified by RNA sequencing across the early- and mid-life portions of the cellular lifespan (linear regression, n = 3 timepoints, r2 = 0.98, p value = 0.012). (e) Analysis of topological similarity, quantified as the correlation across all CpGs that map to a given gene between in vivo and in vitro systems. Each datapoint is the average methylation values across all ages/passages, plotted for each of the top 29 age-associated genes reported in Wang et al. [6]. Significant correlations (p < 0.05) are shown as thick regression lines, with 95% confidence interval (shaded area). Inset: proportion of in vivo – in vitro correlations that are significant correlations (p < 0.01). (f) Same as E but for 46 single CpGs whose methylation levels are positively correlated (p < 0.05) with age [6]. Each graph is for a single CpG and each datapoint (n = 12) reflects time in culture (x axis) and corresponding human ages (y axis). Full size correlation graphs can be found in Supplemental Figure S4.
