Figure 2.

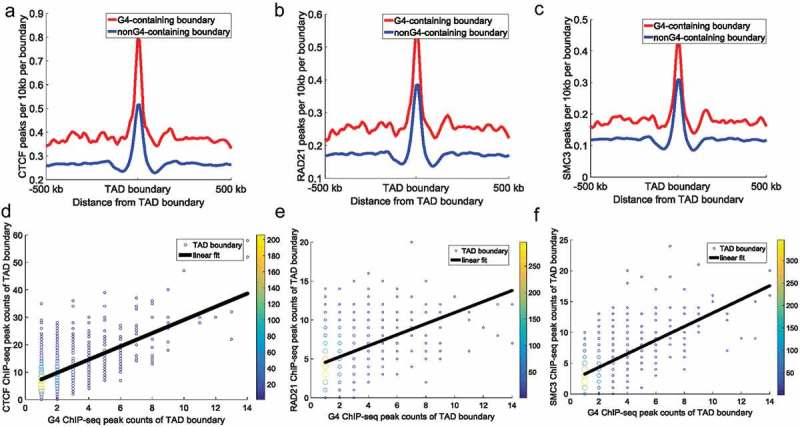
CTCF, RAD21, and SMC3 ChIP-seq peak counts at TAD boundaries. All TAD boundaries were divided into: G4-containing boundaries and non-G4-containing boundaries. (a–c) The top panels represent CTCF (a), RAD21 (b), and SMC3 (c) peak counts around TAD boundaries. Red lines and blue lines indicate G4-containing boundaries and non-G4-containing boundaries, respectively. The y-axes indicate ChIP-seq peak counts per 10 kb per boundary. The Student’s t-test p-value for CTCF, RAD21, and SMC3 ChIP-seq peak counts between the two types of boundaries was 9.20 × 10−71, 1.94 × 10⁻²², and 1.20 × 10−41, respectively. (d–f) The bottom panels represent the relationship between architectural protein (CTCF [d], RAD21 [e], and SMC3 [f]) and G-quadruplexes at G4-containing boundaries. The data points represent different TAD boundaries. The x-coordinates of the plots represent the number of G4 ChIP-seq peaks overlapping with the TAD boundaries, and the y-coordinates of the plots represent the number of architectural protein ChIP-seq peaks overlapping with the TAD boundaries. We calculated G4 ChIP-seq peak counts and architectural protein ChIP-seq peak counts in a 50 kb (±25 kb around TAD boundary) window around each TAD boundary. Different colours show the counts of overlapping boundaries. The black continuous line indicates the linear fit between architectural protein ChIP-seq peak counts and G-quadruplex counts at TAD boundaries (the Pearson correlation coefficient between G4 ChIP-seq peak counts and CTCF, RAD21, and SMC3 ChIP-seq peak counts at TAD boundaries was 0.62, 0.40, and 0.63, respectively [p = 3.10 × 10−82, 5.77 × 10−65, and 6.98 × 10−77, respectively]).
