
Figure 7.
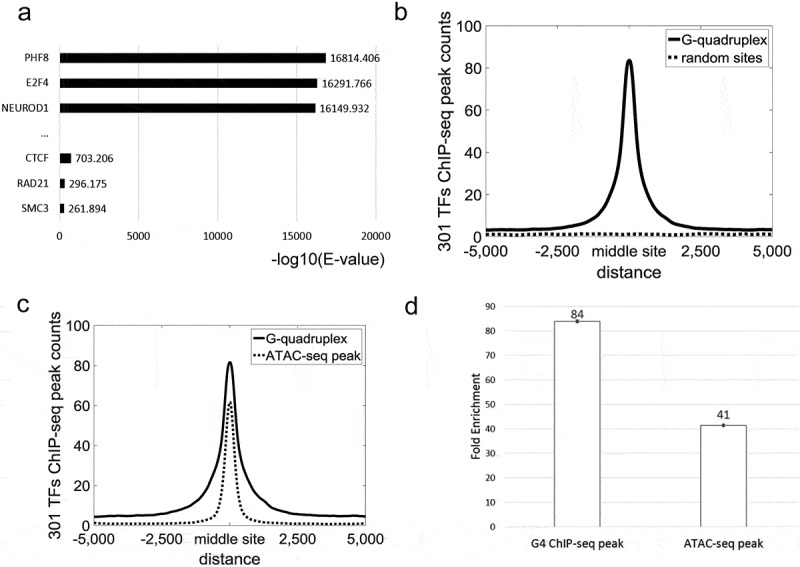
The relationship between TFBSs and G-quadruplexes. (a) Most enriched TFs on G-quadruplexes. (b) Peaks of 301 ChIP-seq datasets around G-quadruplexes. (c) TF ChIP-seq peak counts around G-quadruplexes/ATAC-seq peaks. The ATAC-seq peaks were the most accessible peaks according to peak values. The count of ATAC-seq peaks was equal to that of G4 ChIP-seq peaks. (d) Enrichment analysis of G-quadruplexes and ATAC-seq peaks. Error bars, s.d. (n = 1).