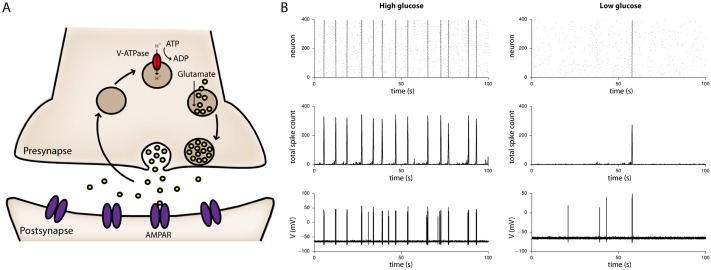
Fig 4. Computational model of synchronous bursting.
A) Cartoon schematic showing that presynaptic vesicle recycling involves several steps suggested to depend on ATP supplied by glycolysis, including endocytosis and vesicle re-acidification by the v-ATPase. In our computational model we encompassed contributions from all pathways in a single term describing the rate of synaptic vesicle recovery and maintenance. B) Simulations reveal that in high levels of extracellular glucose (left), synchronized bursting persists at a higher frequency than when extracellular glucose is low (right), as modelled by reducing the rate of vesicle recovery and maintenance. Upper panels display raster plots of spike timings from all 400 neurons in the simulated network, middle panels the total spike count across the network as a function of time, and lower panels the corresponding fluctuations in membrane potential of a representative neuron.

