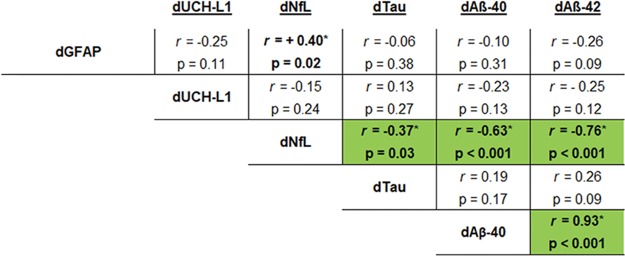
Fig 1. Correlation between biomarker changes.
The mathematically derived changes (delta (d) = post-pre) of biomarker levels were compared to one another using Spearman rank correlation analysis after outlier removal (ROUT = 1%). Values that were statistically significant are indicated (green highlight, *p ≤ 0.05, 1-tailed Spearman rank correlation).

