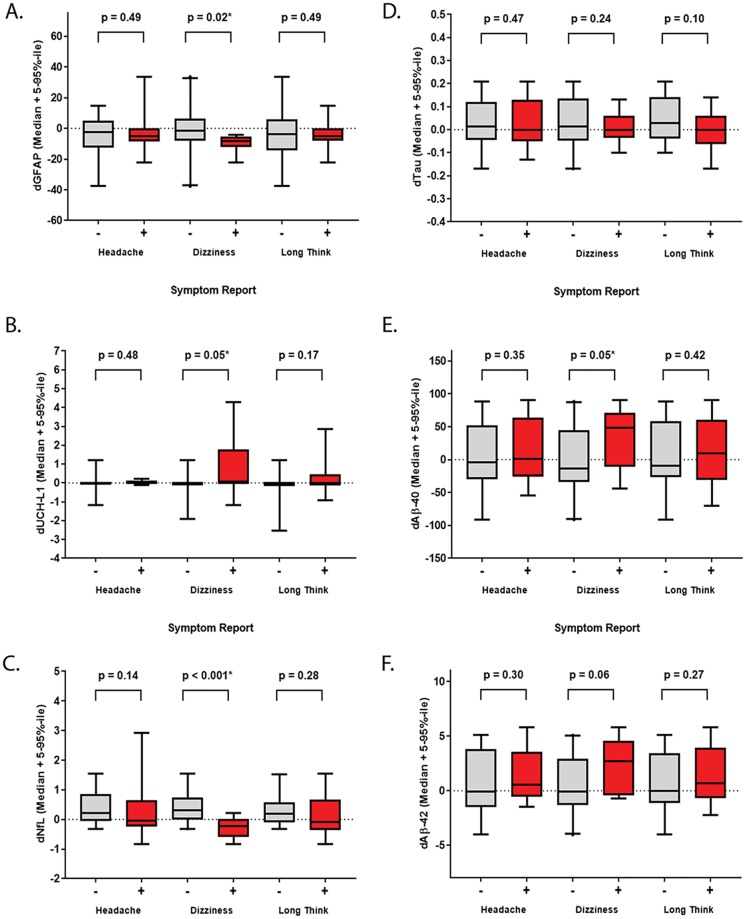
Fig 3. Relationships between changes in biomarker levels and symptoms.
The change (delta (d) = post pre) in biomarker levels were compared to symptomology standardized as binary values. Data is displayed as a box plot (median + 5–95%-ile range) for the content of each biomarker (x-axis) among participants who reported no change or a decrease (grey, -) compared to an increase (red, +) in headaches, dizziness or taking longer to think (y-axis). (A) dGFAP, (B) dUCH-L1, (C) dNf-L, (D) tau, (E) dAβ-40 (F) dAβ-42. Comparisons were conducted after outlier removal (ROUT = 1%). Statistically significant comparisons are indicated (* p ≤ 0.05, unpaired 1-tailed Mann-Whitney or Welch’s t-Test as appropriate).

