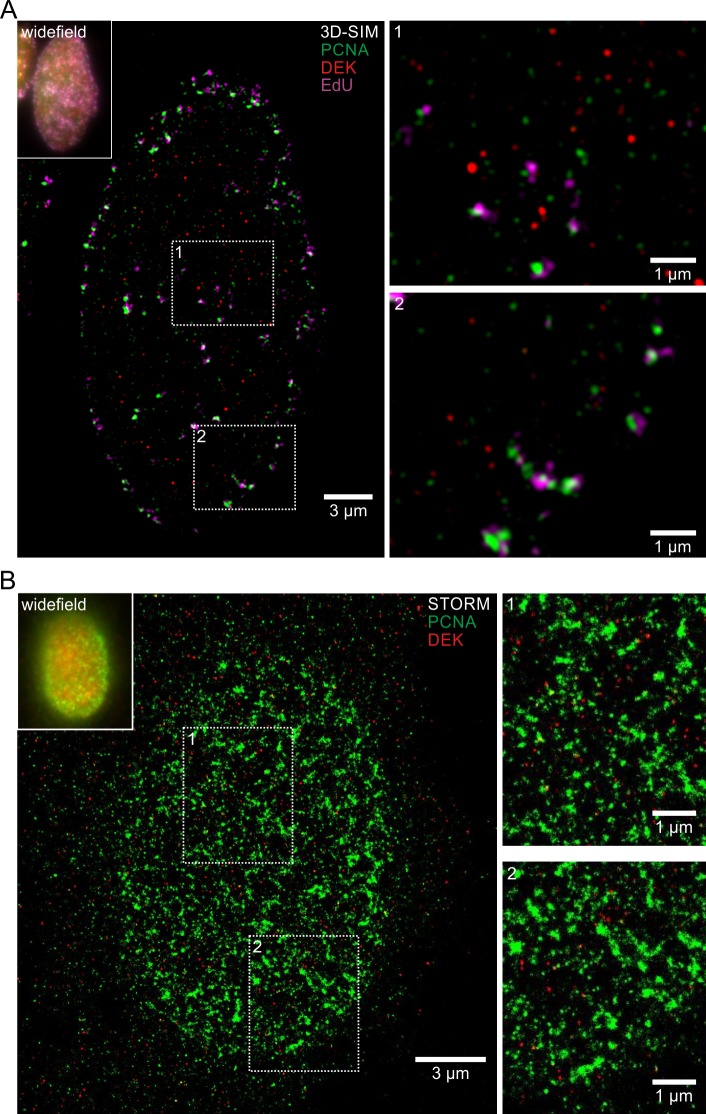
Fig 4. DEK does not colocalize with replication foci in superresolution images.
(A) 3D-SIM superresolution microscopy images of DEK, EdU and PCNA distribution in early/mid S-phase. U2-OS GFP-DEK cells were treated with EdU for 10 min to label nascent DNA via click chemistry, and PCNA was visualized via indirect immunofluorescence. Shown is a single z-slice from the super-resolved image stack with two magnified insets. Red: GFP-DEK, green: PCNA (green), magenta: EdU. Upper left corner: Pseudo-widefield representation of the same nucleus by superimposition of all z-slices. (B) STORM superresolution microscopy images of DEK and PCNA distribution in early S-phase. DEK (red) and PCNA (green) were visualized via indirect immunofluorescence in U2-OS GFP-DEK cells with Alexa405/Alexa647 photoswitchable dye pairs respectively CF568. Shown is a single z-slice with two magnified insets. Top left corner: Widefield image of the same nucleus.

