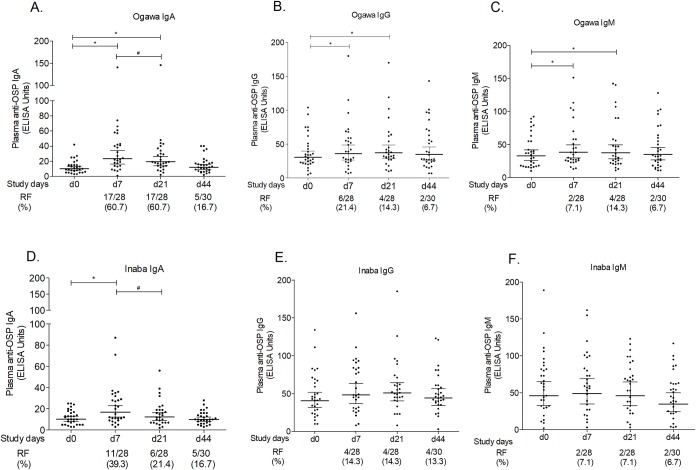
Fig 2. Plasma OSP-specific IgA, IgG and IgM responses.
(A) Immunoglobulin A (IgA), (B) IgG, and (C) IgM responses to Ogawa OSP, and (D) IgA, (E) IgG, and (F) IgM responses to Inaba OSP are indicated. Each single dot indicates an individual OSP antibody value; horizontal bars represent geometric means (GM) and error bars indicate 95% confidence intervals. The Wilcoxon signed-rank test was used for analyses of the data. Asterisks indicate a statistically significant difference from baseline level (day 0). Responder frequencies (RF) are shown below the x axes. # indicates a statistically significant decrease in plasma antibody titers in vaccinees 7 days after the first and second dose of vaccination (at day 7 and day 21), respectively (P ≤ 0.05).

