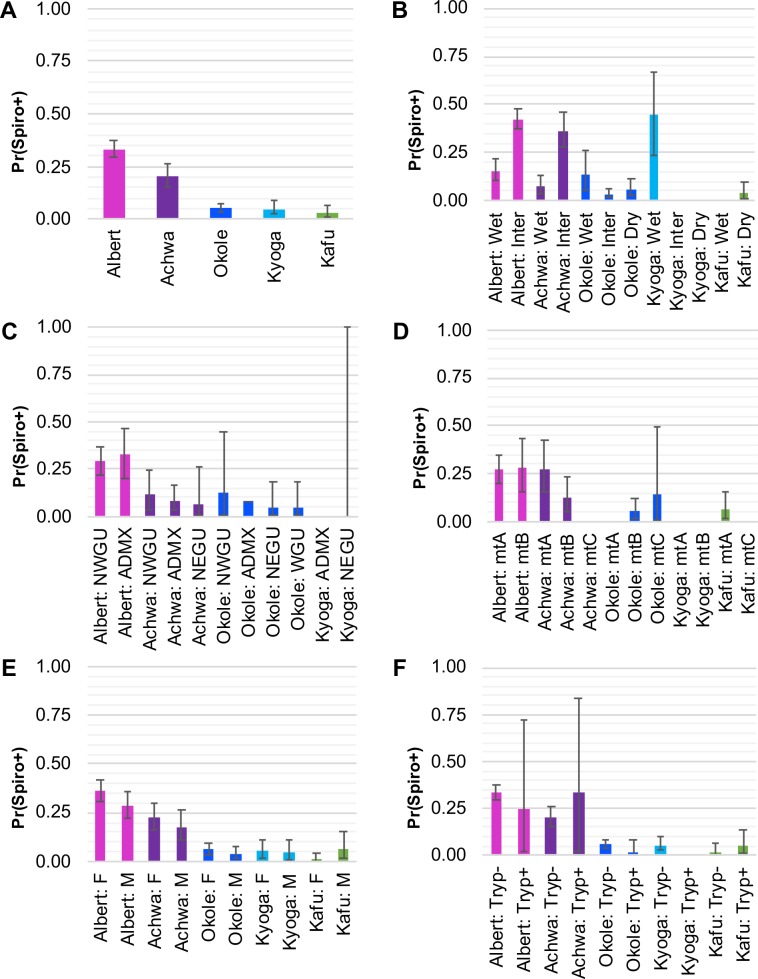
Fig 3. Probability of Spiroplasma infection by watershed.
Results of the generalized linear models (GLM) by watershed of origin showing estimated probability of Spiroplasma infection [Pr(Spiro+)] with lower 2.5% and upper 97.5% bounds for (A) watershed of origin only, (B) season of collection by watershed, (C) Gff host nuclear genetic background (NWGU = northwest genetic unit, ADMX = admixed, NEGU = northeast genetic unit, WGU = west genetic unit), (D) Gff host mitochondrial genetic background (mtA = haplogroup A, mtB = haplogroup B, mtC = haplogroup C), (E) Gff host sex (F = female, M = male), and (F) trypanosome coinfection (Tryp+ = coinfection, Tryp- = no coinfection). Each bar is labeled with the watershed and predictive variable, and color coded by watershed (pink = Albert Nile, purple = Achwa River, dark blue = Okole River, light blue = Lake Kyoga, green = Kafu River). See S5 Table for details and Tukey’s contrasts that assess significance of the associations.

