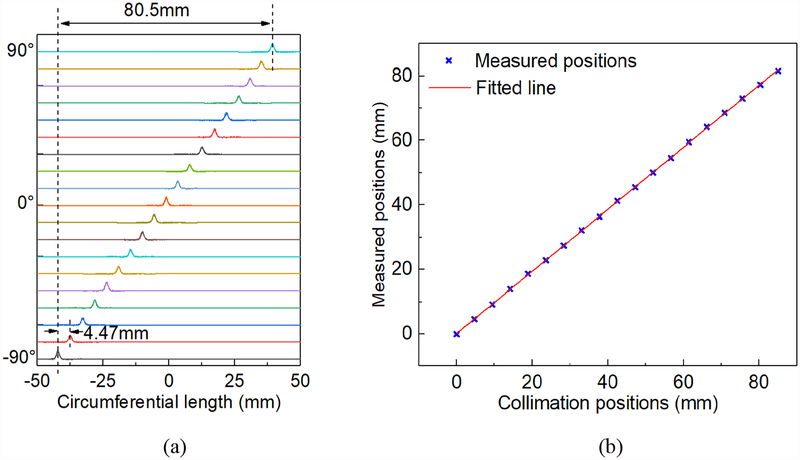
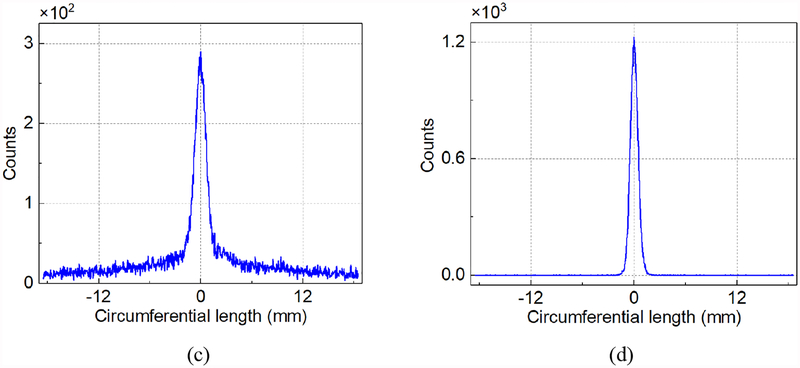
Fig. 6.
(a) The histograms of the positions of the gamma interactions in the θ direction at the step of 10°. (b) The mean of measured positions. (c) A typical histogram of the positions of the gamma interactions in the θ direction, calculated by the average of PA and PB. (d) A typical histogram of Pd.


