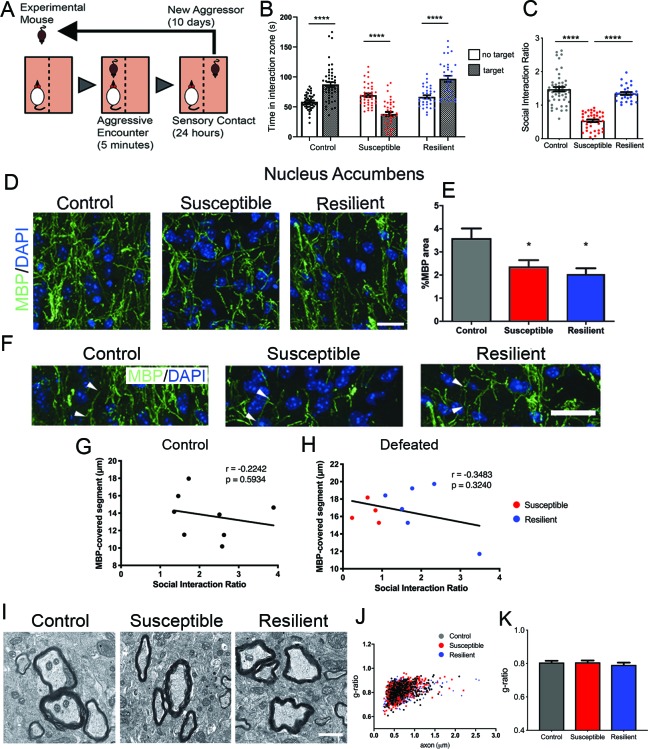
Figure 1. Effect of aggressive social encounters on myelination in the nucleus accumbens (NAc) of mice which showed two behaviorally distinct phenotypes following chronic social defeat stress (CSDS).
(A) The experimental paradigm for CSDS. (B–C) Mice susceptible to CSDS spent less time interacting with a conspecific mouse than the control group or resilient mice, as shown in (B) total time spent in the interaction zone when there is a conspecific mouse present and in (C) social interaction ratio defined by time spent in the interaction zone when a conspecific mouse present divided by a conspecific mouse absent. Control, n = 52; susceptible, n = 39; resilient, n = 33; ****, p<0.0001 by one-way ANOVA followed by Tukey’s post hoc test. (D–E) Representative confocal images and quantifications showing immunohistochemistry of myelin basic protein (MBP) counterstained with DAPI. Scale bar = 28 μm. n = 3 mice per group, two 20x images per animal; susceptible vs. control, p=0.0447; resilient vs. control, p=0.0109 by one-way ANOVA followed by Tukey’s post hoc test. (F) Representative confocal images showing MBP-covered myelinated segments. Arrowheads point to one MBP-covered myelinated segment. Scale car = 19 μm. (G–H) Pearson correlation coefficients showed non-significant correlation of MBP-covered segment length and social interaction ratio in control (G) or defeated (H) mice, control, 8 x-y pairs. r = −0.2242, p=0.5932. defeated, 10 x-y pairs, r = −0.3483, p=0.3240. control, n = 8 mice, susceptible, n = 4 mice, resilient, n = 6 mice, 1–2 20x images per mouse; (I) Representative electron microscopy images (scale bar = 1 μm) and (J–K) scatter plot and quantification of g-ratio; control, n = 5 mice; susceptible, n = 7 mice; resilient, n = 5 mice.

