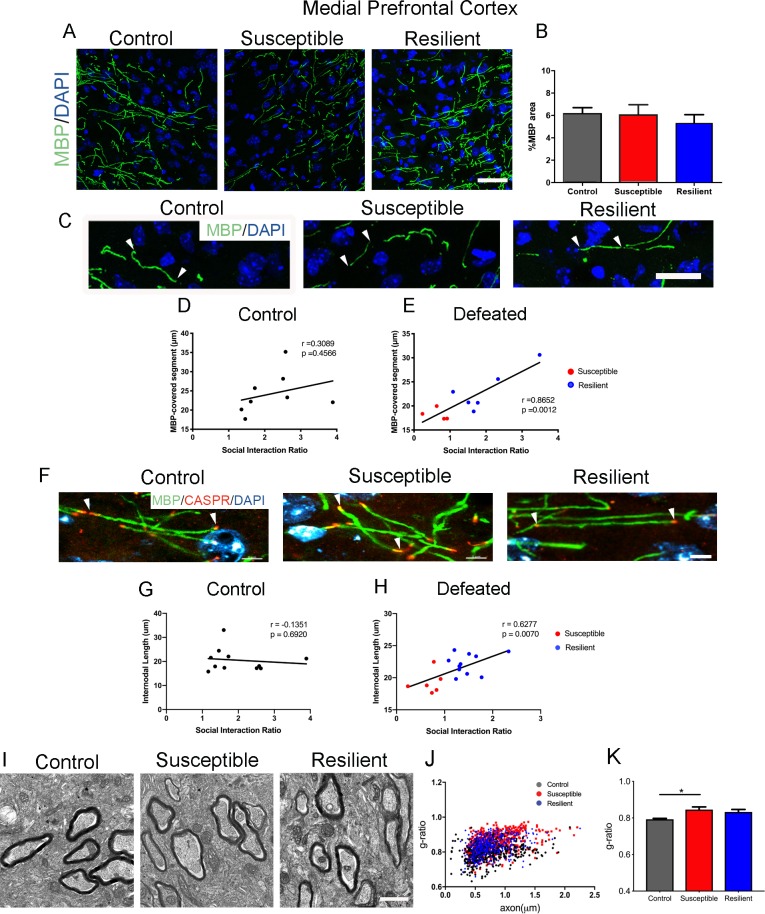
Figure 2. Myelination in the medial prefrontal cortex (mPFC) distinguished resilient from susceptible mice following stress.
(A–B) Representative confocal images and quantifications of myelin basic protein (MBP) counterstained with DAPI. Scale bar = 30 μm. n = 3 mice per group. Four 20x images taken per mouse (C) Representative confocal images showing MBP-covered myelinated segments. Arrowheads point to one continuous MBP-covered myelinated segment. Scale bar = 17 μm. (D–E) Pearson correlation coefficients showed significant correlation of MBP-covered segment length with social interaction ratio only in defeated (E) mice, but not in control (D), control, 8 x-y pairs, n = 8 mice, defeated 10 x-y pairs, susceptible, n = 4 mice, resilient, n = 6 mice, four 20x images were taken per mouse (F) Representative confocal images showing internodal segment marked by CASPR (Red) and MBP (Green). Arrowheads point to one internode. Scale bar = 5 μm. (G–H) Pearson correlation coefficients showed significant correlation of internodal length with social interaction ratio only in defeated (H) mice, but not in control (G), control, 11 x-y pairs, n = 11 mice, defeated 17 x-y pairs, susceptible, n = 6 mice, resilient, n = 11 mice, four-six 63x images taken per mouse. (I) Representative electron microscopy images, scale bar = 1 μm. (J–K) Scatter plot and quantification of g-ratio in the mPFC; control, n = 5 mice; susceptible, n = 7 mice; resilient, n = 5 mice; susceptible vs. control, p=0.0264 by one-way ANOVA followed by Tukey’s post hoc test.

