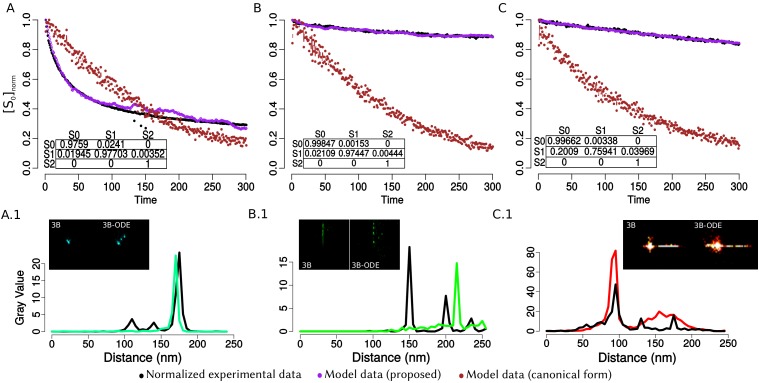
Appendix 1—figure 17. Comparison between the original model of 3B against the obtained with the transition matrix that we propose.
Columns A-C represent the nanorulers GATTA-PAINT labelled with ATTO 488, 550 and 655 respectively. Panels A-C show the normalized experimental data (black dots) and the simulation for 1000 fluorophores with the matrix that we propose (purple dots) and with the original 3B matrix (burgundy dots); each point represents the mean value of the fluorescence. The time is indicated in frames, acquisition time between images is 100 ms. A complete experiment consists of 300 images collected in a CellTIRF microscope with a 160× magnification. Panels A.1- C.1 show two ROI’s from the complete SR images: 3B) canonical reconstruction and 3B-ODE) reconstruction with the ODE’s model. The graph shows a line profile from the two reconstructions, in green the results from original 3B and in black with the transition matrix that we propose, the x-label is the distance in nm and the y-label is the intensity pixel value. The peaks from the graph denote the localization of a fluorophore.

