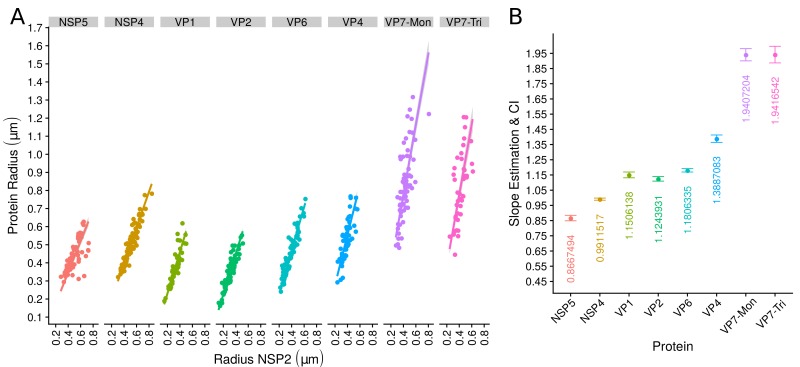
Figure 3. The organization of VPs scales with its size.
(A) Simple linear regression analyses for each component combination (eight subpanels). In all subpanels, the x-axis represents the radius of the distributions of NSP2, and the y-axis the radius of the distribution of the accompanying VP component. The 95% confidence interval, marked in grey, is imperceptible due to goodness of fit of the linear regression (solid line). (B) Slope and confidence interval for each linear regression model (dependent variables in x-axis). The slopes values were shown under each confidence interval.

