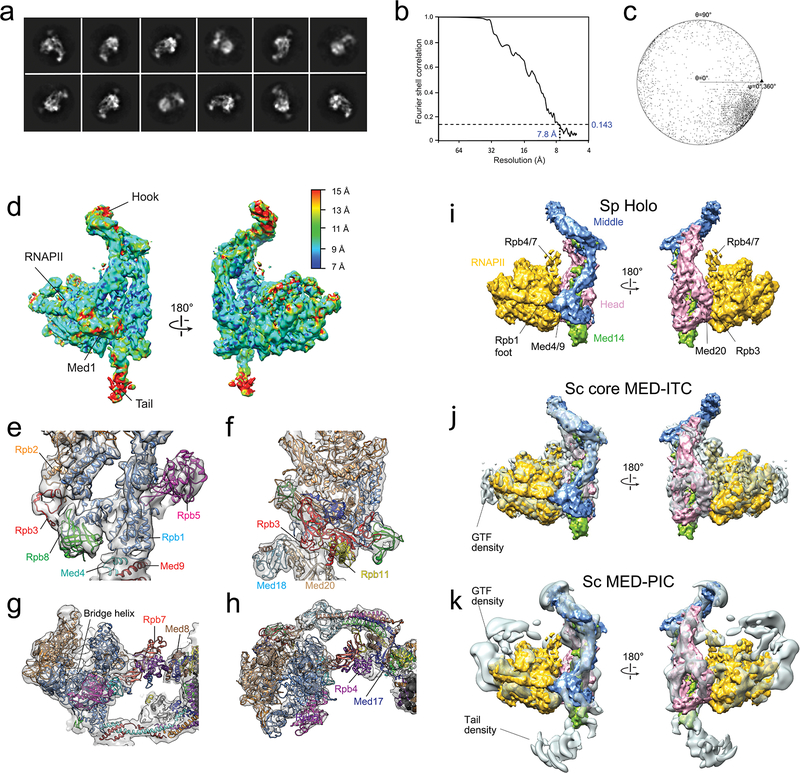
Extended Data Figure 5. Cryo-EM analysis of the Sp holoenzyme and comparison with Sp RNAPII X-ray structure [PDB 3H0G] and Sc core MED-ITC and Sc MED-PIC cryo-EM maps.
a, 2D holoenzyme cryo-EM class averages. b, FSC plot for the holoenzyme cryo-EM map. c, Angular distribution plot for the holoenzyme cryo-EM map. d, Local resolution values in the holoenzyme cryo-EM map. e, The Rpb1 foot portion of PDB-3H0G, and neighboring domains, fitted into the holoenzyme map. f, The Rpb3/Rpb11 portion of PDB-3H0G, and neighboring domains, fitted into the holoenzyme map. g, A slice through the central portion of a front view of PDB-3H0G shows the bridge helix and comparatively weak Rpb4/Rpb7 density making contacts with Med8 and Med17 in the Head. h, A slice through the central portion of a top view of PDB-3H0G shows Rpb4/Rpb7 contacting Med8 and Med17. i, Sp holoenzyme segmented into modules. j, Sc core MED-ITC with modules from Sp holoenzyme fitted in. The gap between Med4/9 and the Rpb1 foot in Sc core MED-ITC is hidden by the fitted Sp holoenzyme Middle. k, Sc MED-PIC (EMDB-8307) with modules from Sp holoenzyme fitted in. There is no gap between Med4/9 and the Rpb1 foot in Sc MED-PIC.

