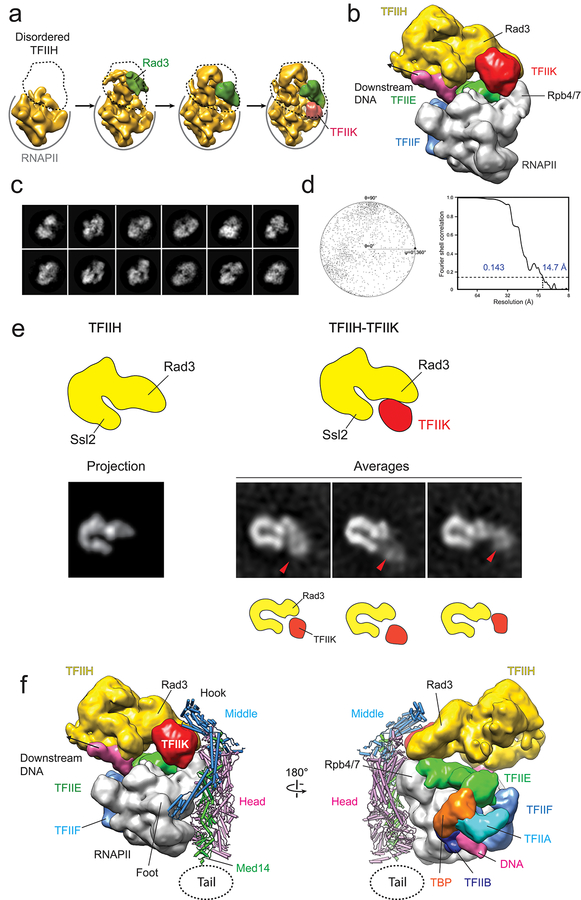
Extended Data Figure 9. Variability in conformation of PIC particles and cryo-EM map of a TFIIK-containing PIC.
a, PIC maps showing various degrees of TFIIH organization. b, Cryo-EM map of a TFIIK-containing PIC. TFIIH and TFIIK are colored in yellow and red, respectively. c, 2D cryo-EM class averages of TFIIK-containing PIC. d, FSC plot for the TFIIK-containing PIC cryo-EM map (left; the resolution was estimated using the gold-standard 0.143 criterium), and angular distribution plot for the TFIIK-containing PIC cryo-EM map (right). e, Comparison between projections of the TFIIH portion of the PIC-TFIIK map calculated from cryo-EM data (left), and 2D class averages calculated from negative-stained images of TFIIH-TFIIK (right). In TFIIH-TFIIK 2D averages, TFIIK can be found in three positions, one of which matches the one observed in the PIC-TFIIK map. f. Possible model for TFIIK-containing PIC interaction with the holoenzyme conformation of Mediator. The position of the mobile Tail is indicated by the dashed circle.

