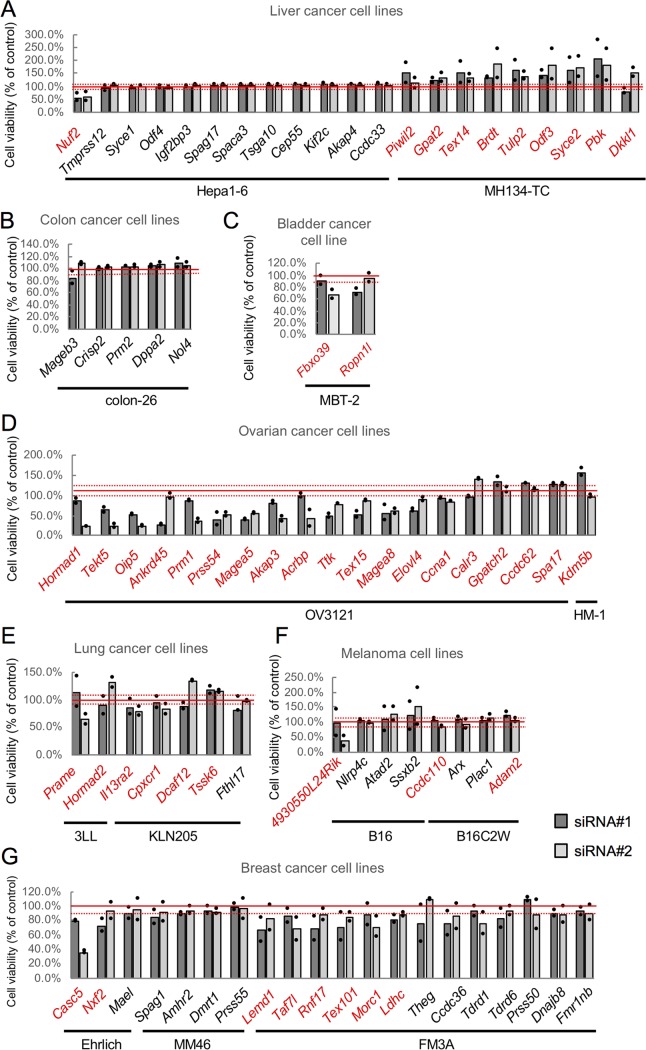
FIG 3.
siRNA screening of mouse CTA genes using the first cell lines. Changes in viability of liver (A), colon (B), bladder (C), ovary (D), lung (E), melanoma (F), and breast (G) cancer cell lines were tested using two different siRNAs (siRNA#1 and siRNA#2) corresponding to the CTA genes whose expression was highest in the respective tested cell lines. Cell viability was determined by MTS assay at 72 h after transfection with the siRNAs. The viability of KD cells relative to that of control cells is shown. Graphs represent data from two biological replicates. Dots indicate values from each of the two replicates. Solid red lines indicate 100% viability; broken red lines indicate 10% increased or decreased viability. Red text indicates genes for which KD (by at least one siRNA) caused a viability change of >10%.

