FIG 5.
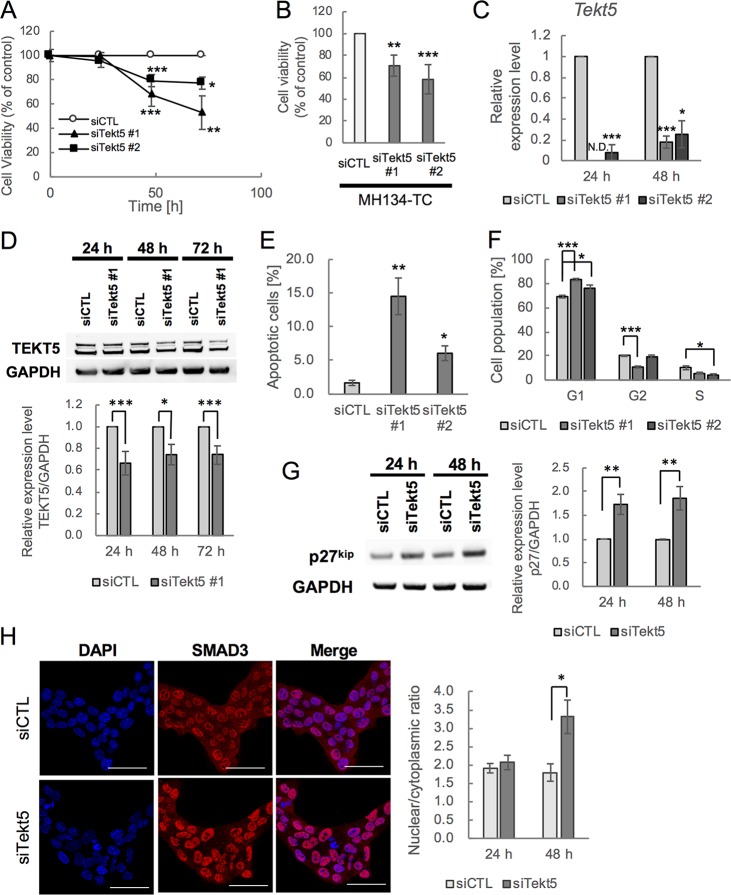
Repression of G1-S transition of cell cycle and cell survival and increased nuclear localization of SMAD3 by Tekt5-KD in OV3121 and MH134-TC cells. (A and B) Changes in viability of an ovarian cancer cell line, OV3121 (A), and of a liver cancer cell line, MH134-TC (B), by two different siRNA corresponding to Tekt5 (siTekt5#1 and siTekt5#2). siCTL, AllStars negative control siRNA. MH134-TC cells were assayed at 72 h after transfection with the siRNAs. Cell viability was determined by MTS assay. (C and D) Decreased accumulation of Tekt5 mRNA as determined by RT-qPCR (C) and of TEKT5 protein as determined by Western blotting (D, upper) after Tekt5-KD in OV3121 cells. For the Western blotting, the signal intensity of TEKT5 was quantified and then normalized against that of the housekeeping protein GAPDH (D, lower). (E and F) Ratios of active caspase-3-positive apoptotic cells (E) and of cells in each phase of the cell cycle (F) at 48 h after transfection of OV3121 cells with Tekt5 siRNA (siTekt5#1), as determined by flow cytometry. (G) Accumulation of p27kip 24 and 48 h after transfection of OV3121 cells with Tekt5 siRNA, as determined by Western blotting (left). The signal intensity of p27kip was quantified and then normalized against that of GAPDH (right). (H) Localization of SMAD3 24 and 48 h after transfection of OV3121 cells with Tekt5 siRNA, as determined by immunostaining (left). SMAD3 accumulation is shown in red at 48 h in the micrographs. Nuclear staining by DAPI (blue) also is shown. Scale bars, 50 μm. Signal intensity of SMAD3 was quantified by confocal laser scan microscopy, and nuclear-cytoplasmic ratios of the protein were determined. N.D., not detected. Graphs represent data from three biological replicates. Values are plotted as means ± the standard errors (SE). *, P < 0.05; **, P < 0.01; ***, P < 0.001 (two-tailed, nonpaired Student t test).

