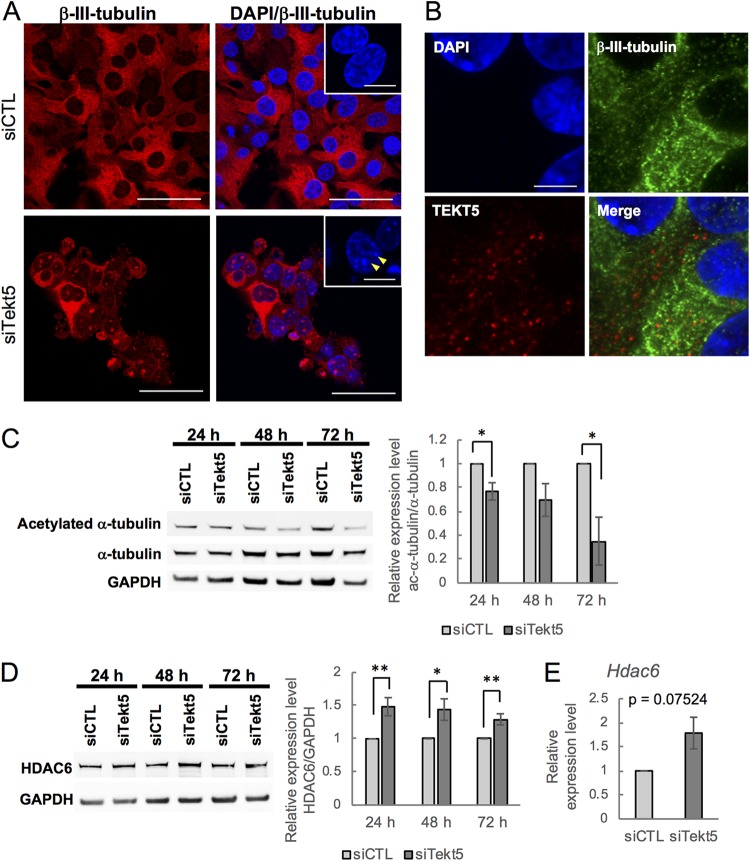
FIG 6.
Abnormality of microtubules in OV3121 cells subjected to Tekt5-KD. (A) Localization of β-III-tubulin (red) in Tekt5-KD (siTekt5) and control (siCTL) OV3121 cells, as detected by immunostaining. Fibrous β-III-tubulin is disrupted by Tekt5-KD. Insets show DAPI-staining in higher magnification. Arrows indicate DAPI-stained dots. Scale bars: 50 and 12.5 μm (insets). (B) Localization of TEKT5 in OV3121 cells. TEKT5 (red) is not colocalized with β-III-tubulin (green). DAPI staining (blue) is also shown. Scale bar, 10 μm. (C and D) The accumulation of α-tubulin (C) and HDAC6 (D) protein in Tekt5-KD and control OV3121 cells, as detected by Western blotting at 24, 48, and 72 h posttransfection. For both panels C and D, each panel consists of an image of the blot (left) and of results (ratios of acetylated [ac] α-tubulin to total α-tubulin [C, right] or of HDAC6 to GAPDH [D, right]) quantified by band intensity. (E) Accumulation of Hdac6 mRNA (D) in Tekt5-KD and control OV3121 cells, as detected by RT-qPCR at 48 h posttransfection. For panels C to E, the graphs represent data from three and five biological replicates for ac α-tubulin and HDAC6/Hdac6, respectively. Values are plotted as means ± the SE. *, P < 0.05; **, P < 0.01 (two-tailed, nonpaired Student t test).

