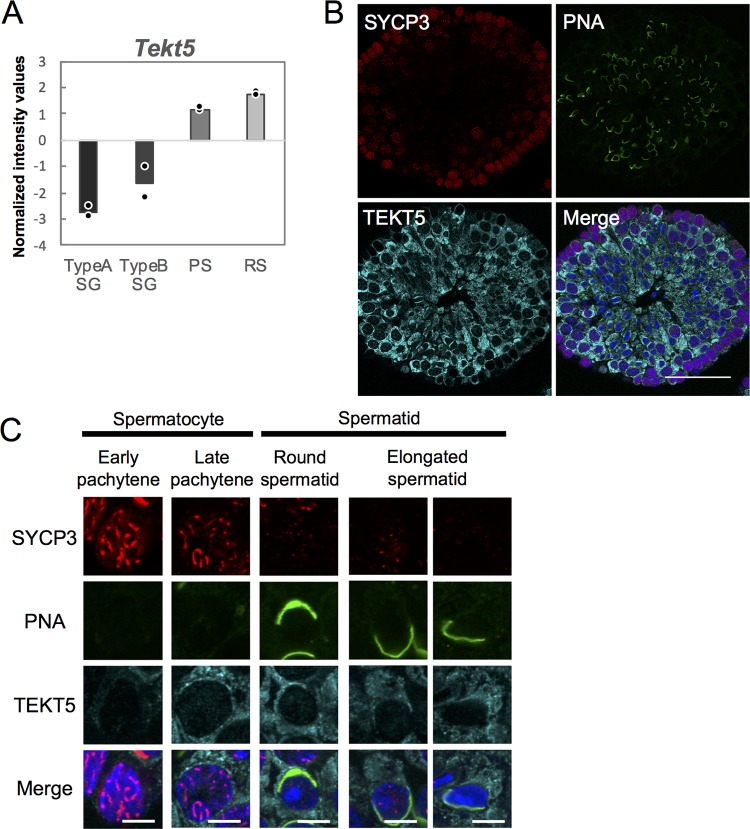
FIG 8.
Expression of Tekt5 in spermatogenic cells. (A) Graph representing signal intensity values normalized using global median scaling for Tekt5 gene expression. The graph is based on published microarray data (GSE4193). Dots show average values from each of two independent data sets. TypeA SG, type A spermatogonia; TypeB SG, type B spermatogonia; PS, pachytene spermatocyte; RS, round spermatid. (B and C) Accumulation of TEKT5 (cyan), SYCP3 (red), and PNA (green) in 3-month-old mouse testes, as detected by immunostaining. Merged images with DAPI (blue) are also shown. The images in panel C show higher magnifications of spermatogenic cells at different differentiation stages classified based on the staining patterns of SYCP3 and PNA. Scale bars, 5 μm.

