FIG 9.
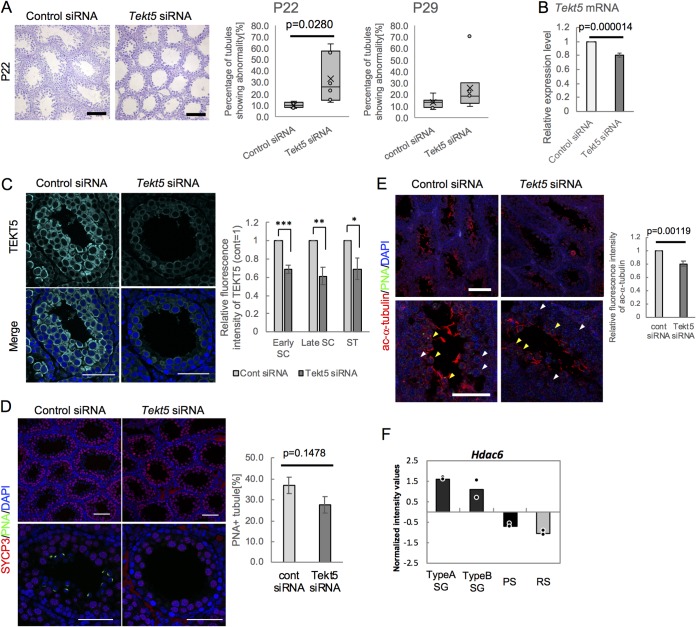
Spermatogenic failure in Tekt5-KD testis at P22. (A) H&E staining of Tekt5-KD and control testes at 22 days of age (left). The graphs show ratios of abnormal seminiferous tubules in Tekt5-KD testis to those in control testis at P22 (left) and P29 (right). Error bars indicate the ranges of minimum and maximum values; Xs and horizontal lines in boxes indicate means and medians, respectively. (B and C) Decreased accumulation of Tekt5 mRNA (B) and TEKT5 protein (C) in Tekt5-KD testis compared to control testis. The expression of mRNA was determined by RT-qPCR (B). The signal intensity of TEKT5 immunostaining (C, left) in early spermatocytes (early SC), late spermatocytes (late SC), and spermatids (ST) (with stages determined based on the staining patterns for SYCP3 and PNA shown in Fig. 6C) was quantified; values were normalized to that in Leydig cells (C, right). Values in control germ cells were set as 1.0. (D) Decreased PNA-positive spermatids (green) in Tekt5-KD testis (left). SYCP3-expressing spermatocytes (red) are not affected by KD. The ratios of seminiferous tubules with PNA-positive cells in counted tubules were determined (right). (E) Decreased acetylated (ac) α-tubulin (red) in Tekt5-KD testis at P22. Yellow and white arrowheads indicate PNA (green)-positive spermatids and PNA-negative spermatocytes, respectively (left). The signal intensity of ac α-tubulin immunostaining was quantified, and values were normalized to those in Leydig cells (right). Values in control germ cells were set as 1.0. (F) Graph representing signal intensity values normalized using global median scaling for Hdac6 gene expression based on published microarray data (GSE4193). Dots indicate average values from each of two independent data sets. TypeA SG, type A spermatogonia; TypeB SG, type B spermatogonia; PS, pachytene spermatocyte; RS, round spermatid. Blue shows DAPI staining. Scale bars: 200 μm (A), 50 μm (C and D, lower), 75 μm (D, upper), 100 μm (E, upper), or 25 μm (E, lower). Graphs represent data from six and nine mice at P22 and P29, respectively, after injection of Tekt5 siRNA and control siRNA in left and right testes, respectively. Values in panels B, C, and D are plotted as means ± the SE. *, P < 0.05; **, P < 0.01; ***, P < 0.001 (two-tailed, nonpaired Student t test).

