FIG 2.
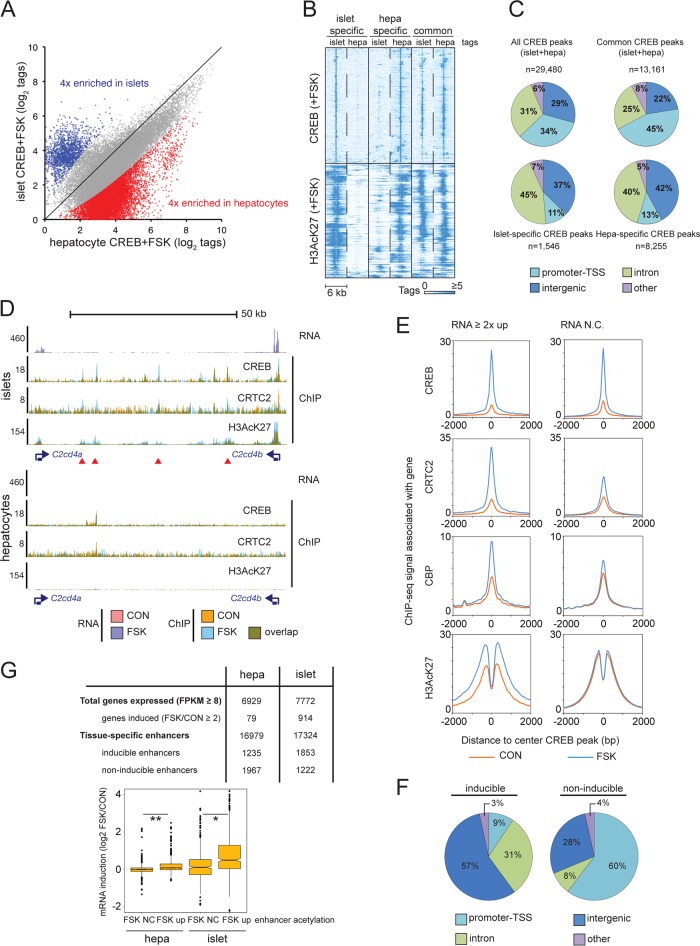
CREB triggers cell-specific gene expression through distal enhancer activation. (A) Scatter plot comparing tag enrichment in CREB ChIP-seq experiments of cultured primary mouse islets and hepatocytes (1 h of FSK exposure). Tissue-specific enrichment (≥4-fold) of CREB binding in islets and hepatocytes is highlighted. (B) Heat map depicting CREB occupancy restricted to activated genomic regions (H3AcK27-decorated promoters and enhancers) that are tissue specific or shared between islets and hepatocytes. (C) Pie charts showing genomic distribution of common and cell-restricted CREB peaks. The majority of tissue-restricted CREB occupancy occurs in TSS-distal genomic loci (promoter-TSS, −1,000/+100 bp from TSS). (D) Browser plot of a genomic region containing two beta cell-restricted CREB target genes, C2cd4a and C2cd4b, and intervening superenhancer. RNA-seq and ChIP-seq data collected under basal conditions (orange) and upon FSK exposure (blue) in primary islets and hepatocytes (2 h for RNA-seq, 1 h for ChIP-seq). (E) Histograms showing genome-wide occupancy profiles for CREB, CRTC2, CBP, and H3AcK27 across CREB binding sites annotated to cAMP-inducible or noninducible (RNA no change [RNA N.C.]) genes. Exposure to FSK is indicated. (F) Pie charts showing relative genomic distribution of CREB occupancy for cAMP-inducible and noninducible enhancers in INS-1 cells. (G) Enhancer activation (H3AcK27 signal FSK/CON, ≥2) correlates with cAMP-inducible gene expression in primary mouse hepatocytes and islet tissue. Relative numbers of inducible enhancers and target genes are indicated. Box plot shows correspondence between enhancer H3AcK27 inducibility in response to FSK and target gene induction. RNA-seq data were taken from experiment shown in Fig. 1B. *, P < 1 × 10⁻¹³; **, P < 1 × 10⁻¹⁵.

