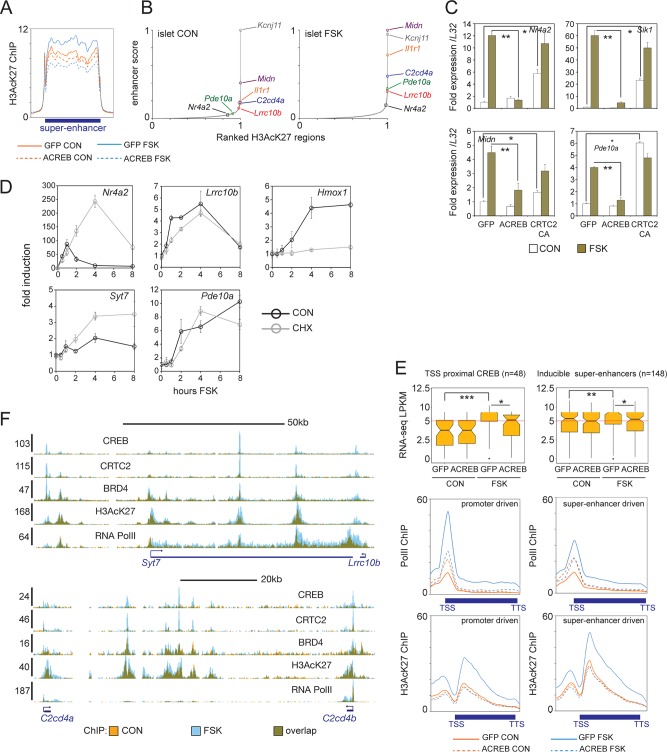
FIG 3.
CREB promotes gene expression from superenhancers. (A) Metagene analysis of H3AcK27 occupancy over superenhancers in INS-1 cells (n = 606). Effects of FSK treatment and ACREB expression are shown. (B) Enhancer ranking based on H3AcK27 ChIP-seq signal in primary islet tissue under basal and FSK-treated conditions. Genes located inside enhancers are indicated. (C) Relative effect of FSK on core (Nr4a2 and Sik1) and beta cell-restricted CREB target genes located in superenhancers (Midn and Pde10a) in INS-1 cells. Cells infected with control (GFP), ACREB, or CRTC2(S171A) adenovirus are indicated. qPCR data are presented as expression over basal levels in control GFP adenovirus-infected cells. *, P < 0.007; **, P < 0.003. (D) Time course analysis of mRNA levels in INS-1 cells exposed to FSK. mRNA profiles of core (Nr4a2) and beta cell-restricted (Lrrc10b, Syt7, and Pde10a) CREB target genes are shown. Effect of cycloheximide (CHX) on CREB or HIF target (Hmox1) gene expression are indicated. (E, top) Box plots showing FPKM values from RNA-seq studies of promoter- or superenhancer-driven CREB target genes in INS-1 cells maintained under basal conditions and following exposure to FSK. Cells expressing control (GFP) or ACREB are indicated. (Bottom) Metagene analysis of RNA Pol II and H3AcK27 enrichment over promoter- and enhancer-driven CREB targets. *, P < 0.004; **, P < 0.002; ***, P < 1 × 10⁻⁶. TTS, transcription termination site. (F) Browser plots of two conserved beta cell-specific superenhancer regions in INS-1 cells. Effect of FSK on CREB, CRTC2, BRD4, and H3AcK27 occupancy on Pol II elongation is shown. y axis values indicate normalized tag enrichment.

