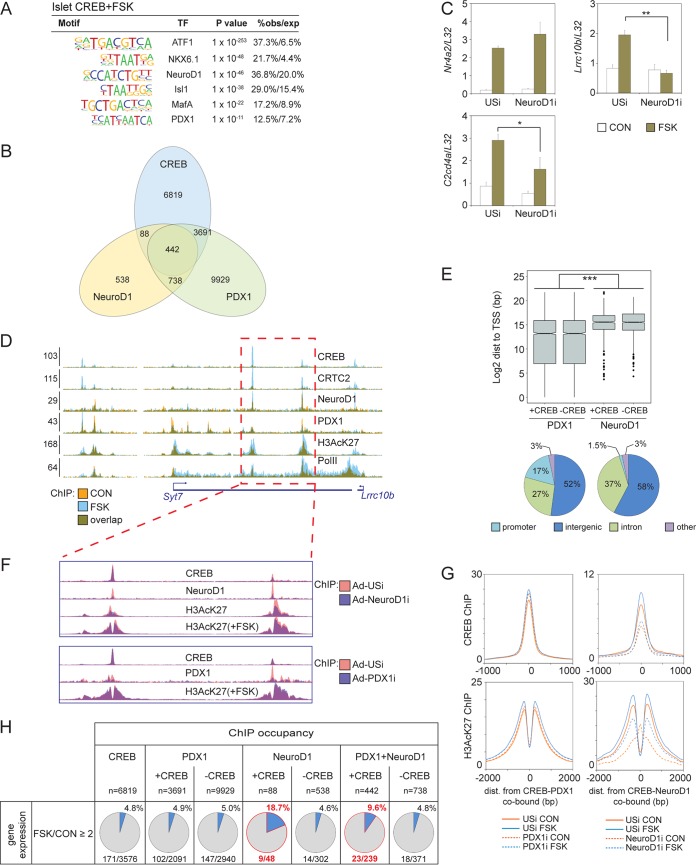
FIG 5.
Neurod1 promotes cAMP-inducible gene expression in beta cells. (A) Motif analysis of tissue-specific CREB binding loci in mouse islets showing enrichment of lineage-defining transcription factor (TF) binding motifs. obs/exp, observed/expressed. (B) Overlap of CREB, NeuroD1, and PDX1 genomic occupancy in INS-1 cells. (C) Effect of RNAi-mediated depletion of Neurod1 on induction of core (Nr4a2) or cell-restricted (Lrrc10b and C2cd4a) CREB target genes by FSK in INS-1 cells. *, P < 0.04; **, P < 7 × 10⁻⁴. (D) Browser plot depicting binding of Neurod1 and Pdx1 in the Syt7/Lrrc10b-inducible superenhancer in INS-1 cells. Colocalization of Neurod1 and Pdx1 with CREB over inducible enhancers is indicated. Effect of FSK is shown. y axis values indicate normalized tag enrichment. (E, top) Box plot showing genomic distribution (dist) of Pdx1- and Neurod1-bound loci relative to TSS for genes with (+CREB) or without (−CREB) cobound CREB peaks in INS-1 cells. ***, P = 0. (Bottom) Pie charts showing relative genomic distribution of Pdx1 and Neurod1 peaks in INS-1 cells. (F) Effect of Neurod1 or Pdx1 depletion on enhancer activity and CREB occupancy on the Syt7/Lrrc10b enhancer. (G) Histograms showing relative effect of Pdx1 or Neurod1 knockdown on CREB and H3AcK27 occupancy over CREB-Pdx1-cobound (left) or CREB-Neurod1-cobound loci (right) in INS-1 cells. Exposure to FSK is shown. (H) Correspondence between CREB-Neurod1 or CREB-Pdx1 cobinding relative to CREB, Neurod1, and Pdx1 alone on cAMP inducibility of proximal genes in INS-1 cells.

