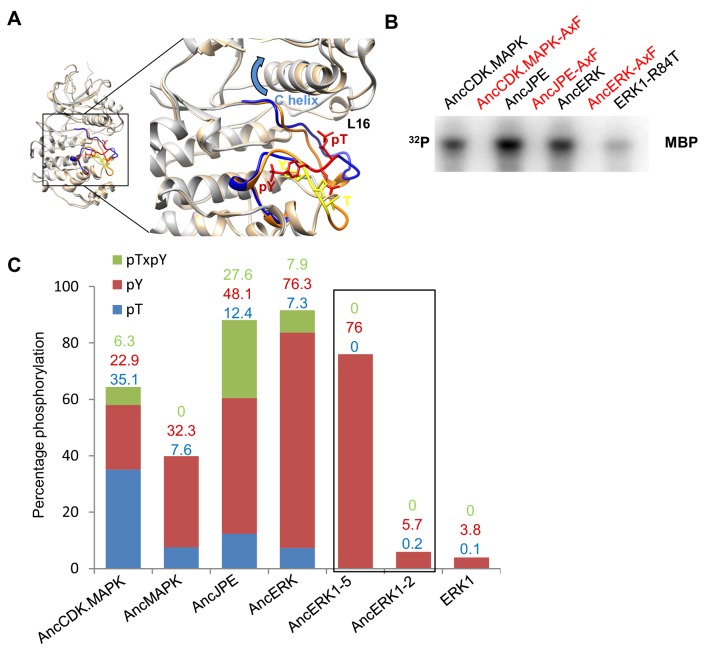
Figure 2. Higher basal activity of inferred ancestors is due to autophosphorylation on the TxY motif.
(A) Superposition of ERK2 (gray, Protein Data Bank code 1ERK) and phosphorylated ERK2 (tan, Protein Data Bank code 2ERK). The activation segment (ribbon diagram) and the ‘TEY’ motif (represented as sticks) are colored orange and yellow for ERK2, blue and red for phosphorylated ERK2. Phosphorylation of the TEY motif leads to a conformational change that remodels the activation loop to enable substrate binding, and rotation of the C helix (arrow) leading to interaction between Lys (K52) on the β3 strand and Glu (E69) on the C helix. Part of Loop L16 adopts a helical conformation in phosphorylated ERK2. (B) Kinase activity of wildtype and AxF mutants of inferred ancestors towards MBP. (C) LC-MS quantification of phosphorylation levels threonine and tyrosine in the ‘TEY’ motif in reconstructed ancestral kinases and ERK1. Bar graphs indicate the relative abundance of various phosphorylated forms of tryptic peptides that contain the ‘TEY’ motif.


