
Appendix 13—figure 2. Dependence of the neural response on the geometry of the filaments.
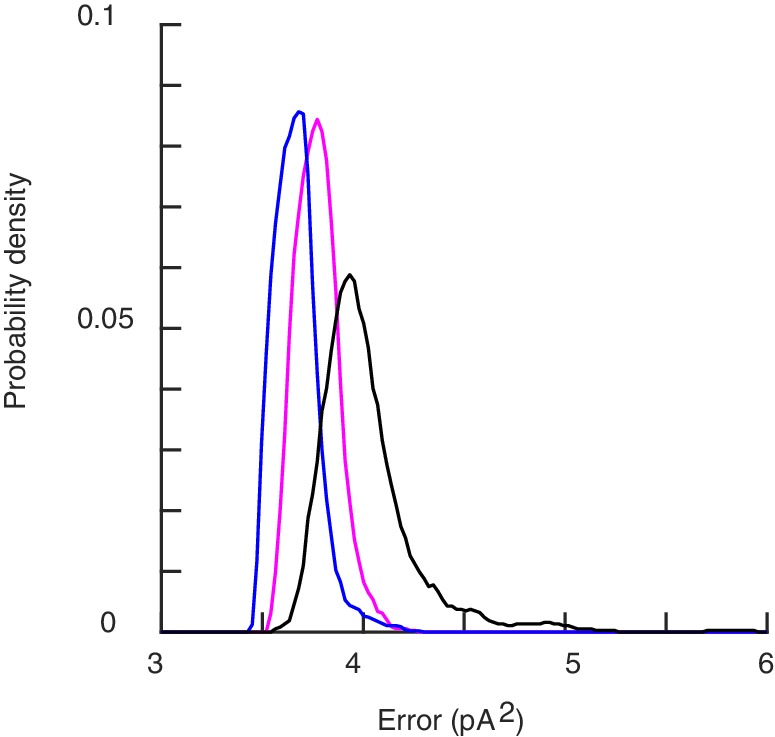
The error for the profiles of stimulation in Figure 3 of the main text. The black histogram is built from individual realizations for the unconstrained model discussed in the main text. The purple and the blue curves refer to the corresponding histograms for filaments initially or permanently restricted to be tangential to the neural membrane.