. 2019 Jul 19;8:e45952. doi: 10.7554/eLife.45952

Figure 3. Potential mechanism for fitness differences at different loci in gtsB.

(A) Bars represent the mean of each variable in units relative to the WT. Experimental relative fitness and transcriptional expression of YFP measures include standard error. See Figure 3—source data 1. (B) Locations of potential transcriptional start sites in the gts operon are represented by vertical arrows. 5’ ends were identified by 5’ RACE analysis of RNA isolated from cultures of the wild type (SBW25) and four gtsB mutants. The location of each gtsB mutation is indicated by a red line, and the nucleotide distance from each 5’ end to the nearest start codon is given. See Figure 3—source data 2; sequence information for the 5’ RACE analysis is found in Figure 3—figure supplement 1.

Figure 3—source data 1. YFP, fitness and promoter strength data.
DOI: 10.7554/eLife.45952.011
Figure 3—source data 2. 5RACE experiment results.
DOI: 10.7554/eLife.45952.012
Figure 3—source code 1. Analysis of promoter strength.
DOI: 10.7554/eLife.45952.017

Figure 3.

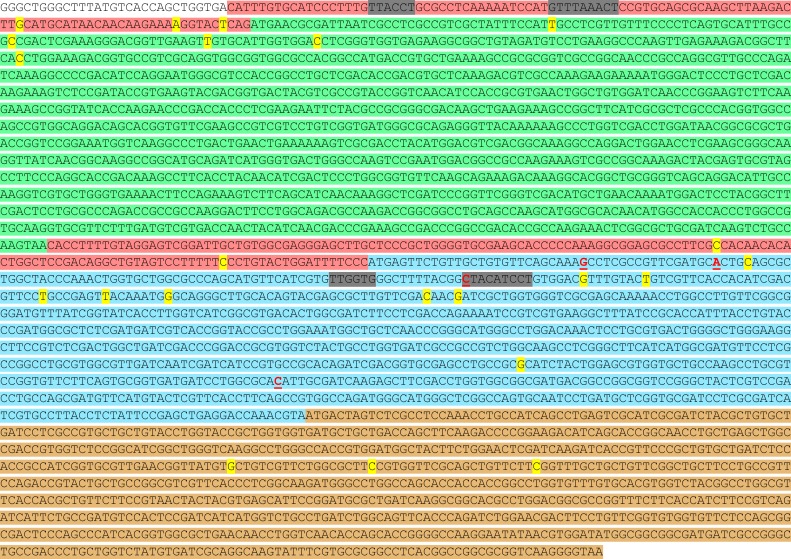
Figure 3—figure supplement 1. Locations of potential transcriptional start sites in the gts operon.

Figure 3—figure supplement 1.

The precise nucleotide positions of the 5’ ends are highlighted yellow within the intergenic (pink) and coding sequences of gtsA (green), gtsB (blue), and gtsC (brown). Positions of gtsB mutations (A10T, A15A, G38G, and 232–3T) are in red text and underlined. Predicted promoter sites using Softberry’s BPROM prediction software are highlighted grey.