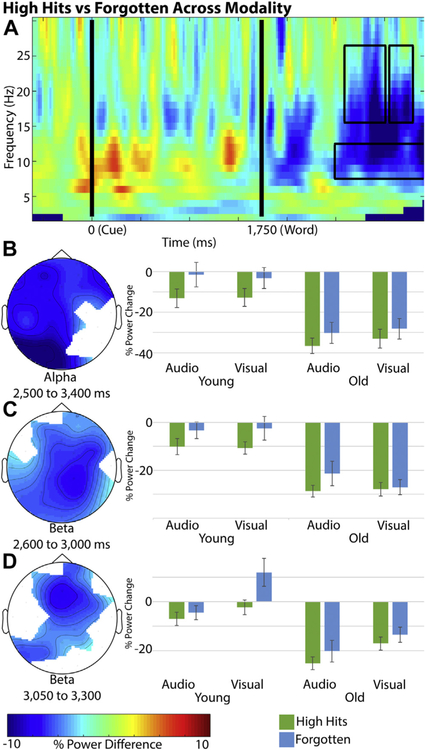
Fig. 2.
The heat and topographic maps represent the difference in percent change from baseline between high confident hits and forgotten trials across all participants and modalities. Bar charts are the average percent change from baseline within the identified electrode cluster. Error bars = 1 SEM. (A) The intersecting electrodes from the 3 identified alpha and beta band clusters were averaged together for visualization of the time-time-course in the heat map. (B) Poststimulus alpha power cluster (750–1650 ms poststimulus). (C) Poststimulus beta power cluster (850–1250 ms poststimulus). (D) Poststimulus beta power cluster (1300–1550 ms poststimulus).

