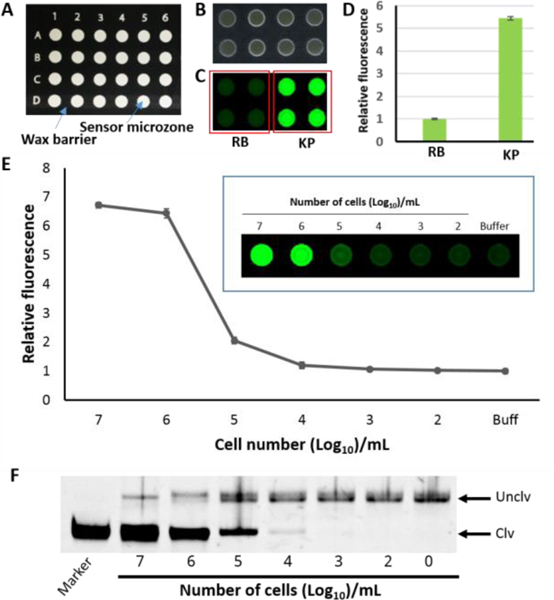
Figure 3.

A) Design of paper sensor. B) Physical appearance of the paper device after printing of the DNAzyme. C) Cleavage and fluorescence signaling test of the paper device. D) Quantified fluorescence signal of C. E) Sensitivity test of RFD-KP6 with KPC with the paper microzone assay. Insert: fluorescent image of paper microzones with varying numbers of bacterial cells. The error bars are standard deviations of triplicate experiments. F) a representative denaturing gel
