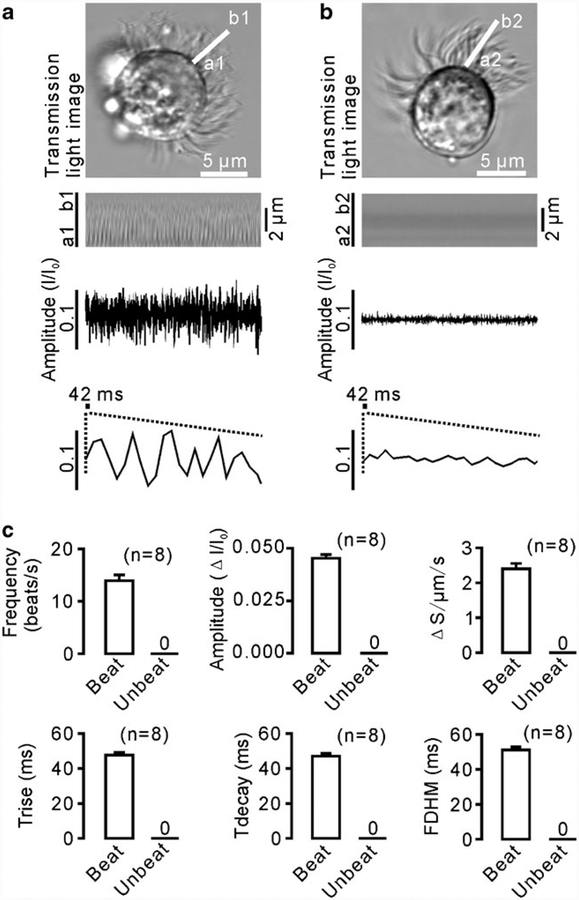
Fig. 2.
CBA recording and analysis. a An xy-image and a line scan image of a beating ciliated cell. The scan line a1b1 was drawn parallel to the long axis of the cilia, and a time-intensity trace was generated from the line scan image. Each individual waveform was clearly visible, and therefore, the waveforms were visually counted to calculate the frequency. Notably, the patterns of individual waveforms were often not identical, indicating that a cilia beat is very complicated. b When the cilia were quiescent, no waveforms were observed. c The values of the six parameters were equal to 0

