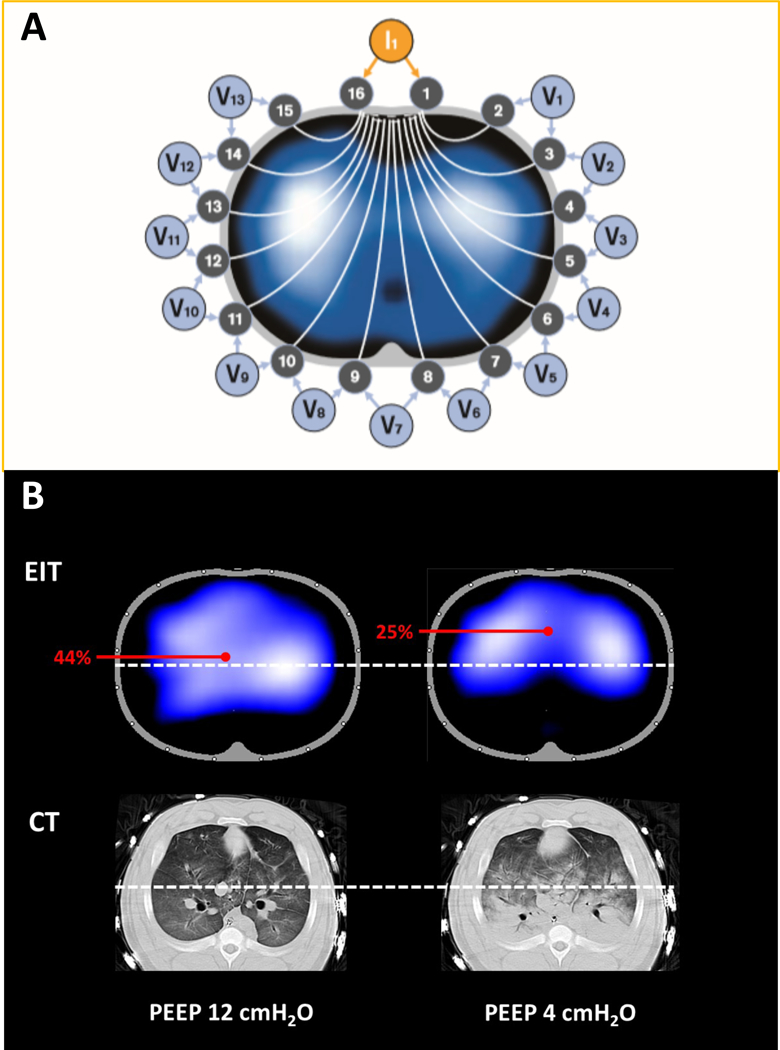
Figure 11:

Electrical impedance tomography (EIT) determines the distribution of intra-thoracic impedance (Z) by applying a known alternating current (I) to an initial pair of electrodes and measuring the resulting surface potentials (voltage, V) at each of the remaining 13 pairs of electrodes (Panel A). Next, the current is applied to the adjacent electrode pair of electrodes and the V recorded at the other electrodes; this cycle is repeated for one cycle of current applications, resulting in one set of EIT raw data expressed as inspiratory cyclic changes in impedance (ΔZ) (Adapted from Drager). The cycle takes 0.02 seconds; it is repeated continuously in each of the circuits in sequence, and the impedance is continuously measured. Because of the multiple circuits around the chest, ΔZ can be localized approximately to each of the quadrants. Because an increase in circuit impedance reflects an inspiratory increase in aeration, ΔZ reflects ventilation of the region in question. Panel B demonstrates the distribution of ventilation using EIT, and the corresponding aeration in CT images, in a pig with lung injury. At PEEP 12 cmH2O, distribution of ventilation is homogeneous (left upper). The white-dots identify the mid-line bisecting the thorax. The center of ventilation (COV) is calculated as [(ΔZ in dorsal half of lung) x 100]/[ΔZ in whole lung];187 if the mid-line is positioned, the % of ventilation that is dorsal is shown on the EIT display (and reflects COV) so that off-line calculation is not necessary. In this example (left upper), with PEEP 12 cmH2O, COV is 44%, and the corresponding CT shows no lung collapse (left lower). In contrast, when the PEEP is reduced to 4 cmH2O, ventilation is shifted to non-dependent lung at and COV is now 25% (right upper), and the corresponding CT confirmed the presence of dorsal atelectasis in the same region (right lower).
