
Figure 4:
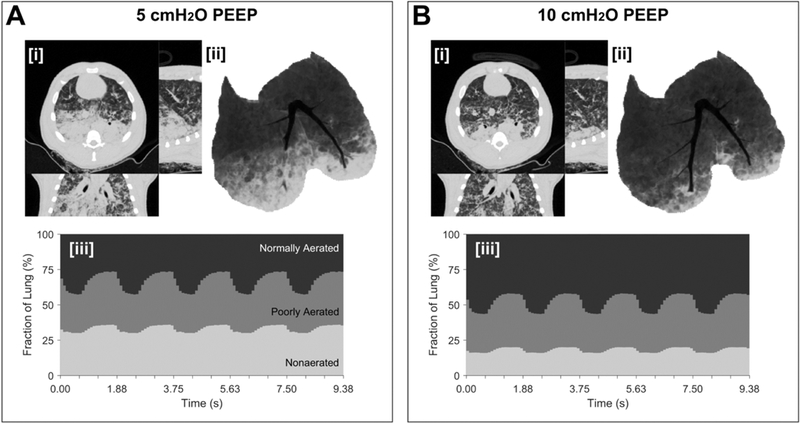
Dynamic computed tomography (CT) illustrates the real-time spatial distribution of lung aeration during mechanical ventilation in experimental lung injury. Lung injury was induced by oleic acid infusion (see video - Supplemental Digital Content 2). Pressure-controlled ventilation (driving pressure 20 cmH2O, rate 32 min−1, Inspired O2 40%) with lower PEEP (5 cmH2O, Panel A) or higher PEEP (10 cmH2O, Panel B) was used. In each panel, [i] end-inspiratory CT (transverse, sagittal, coronal planes), [ii] minimum intensity projection voxels, and [iii] time- varying fractions of lung at normally-aerated, poorly-aerated and non-aerated levels are illustrated. The following features are observed. Hyperaerated tissue (not visible) accounted for <1% of lung voxels at either level of PEEP. The intra-tidal changes in normal, poorly and non-aerated fraction were 15, 10 and 5%, respectively, at the two PEEP levels. However, there was a nearly two-fold increase in non-aerated tissue at the lower PEEP, as well as noticeable flooding of large bronchi in the right lung and arterial hemoglobin O2 saturation was 92 vs. 63% with PEEP 10 vs. 5 cmH2O. Normal, poor and non-aeration is considered: −900 to −500, −500 to −100, and above −100 HU, respectively.