
Figure 2.
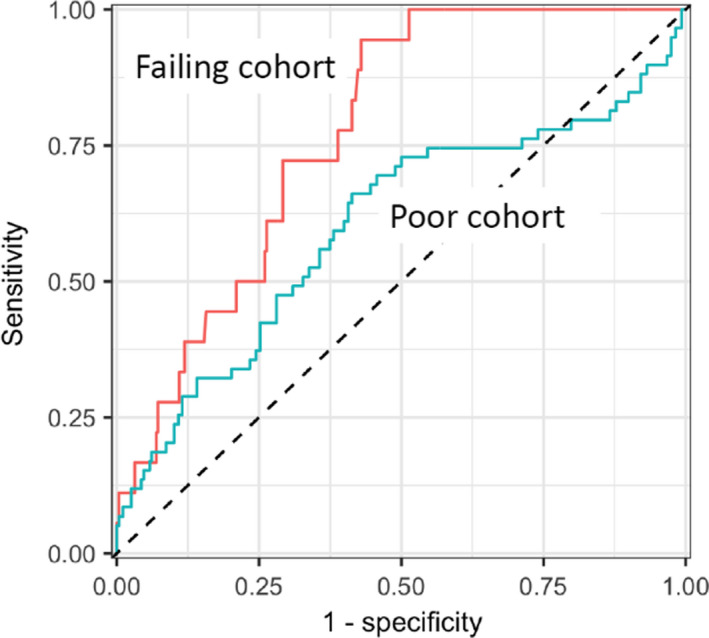
Receiver operator characteristic (ROC) curves for all phantom results as evaluated by the Imaging and Radiation Oncology Core (IROC) recalculation. The higher line shows the ROC for the failing phantom result cohort area under the curve (AUC = 0.78) while the lower line shows the ROC for the poor phantom result cohort (AUC = 0.60). [Color figure can be viewed at wileyonlinelibrary.com]