Figure 3.

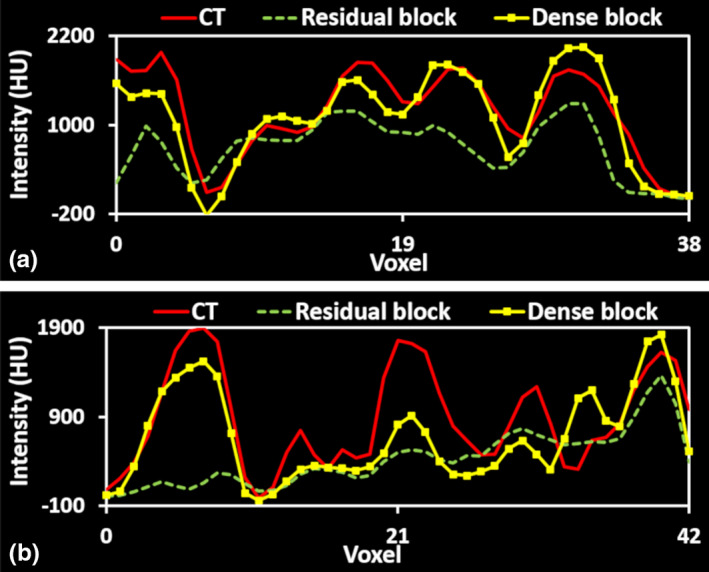
Line profile comparison between cycle‐GAN with residual blocks and the proposed method. (a) and (b) are plot profiles of red lines in [Figs. 4(b2)–4(b4) and 4(d2)–4(d4)]. [Color figure can be viewed at wileyonlinelibrary.com]

Line profile comparison between cycle‐GAN with residual blocks and the proposed method. (a) and (b) are plot profiles of red lines in [Figs. 4(b2)–4(b4) and 4(d2)–4(d4)]. [Color figure can be viewed at wileyonlinelibrary.com]