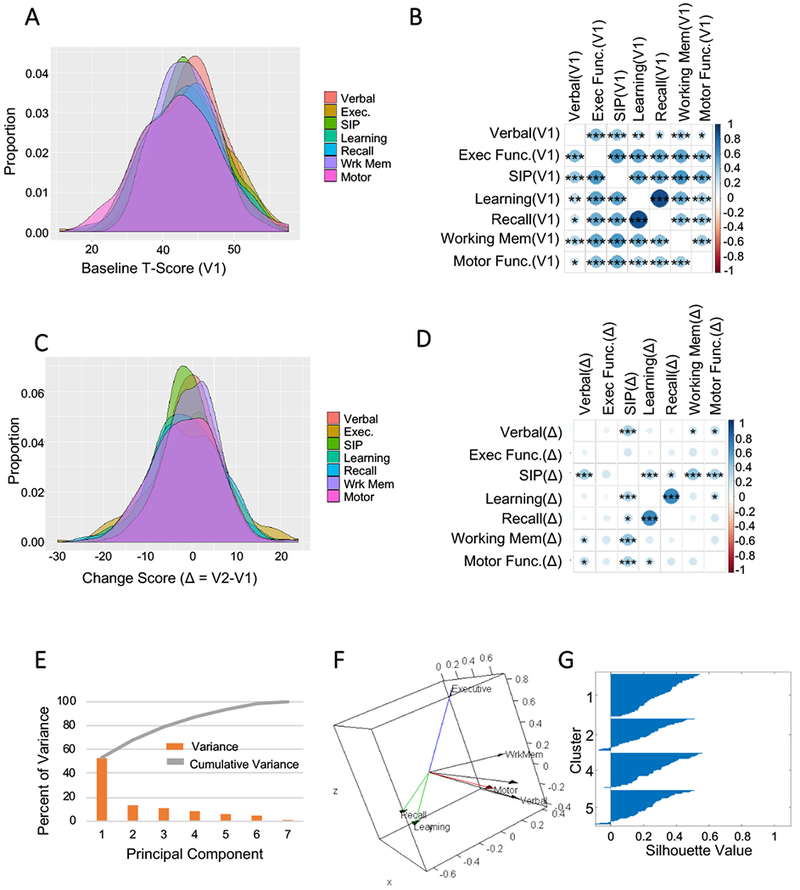
Figure1:

Identification of cognitive domain phenotypes. A) Distribution of baseline T-Scores in all domains. T-Scores are normalized so that the average in healthy controls is 50 with a standard deviation of 10. B) Correlation plot of the baseline (V1) T-Scores in each cognitive domain. C) Distribution of change scores (V2-V1) for each cognitive domain. D) Correlation plot of the change scores for each of the indicated cognitive domains. The size and color of the circles corresponds to the strength of Pearson’s correlation coefficient. Larger and darker circles are more strongly correlated. E) Individual and cumulative percent of the variance explained by each principal component of the cognitive change scores. F) Loading plot of the domain variables for the first three principal components. The vectors represent the coefficient of the variables on the components. Cognitive domain change scores that cluster together are represented by color. Executive function (green), Working memory, speed of information processing, and verbal fluency (red), motor function (black), and learning with recall (blue). G) Silhouette plot showing subject clustering based on their principal component values. n=193 subjects. * = p <0.01, ** = p < 0.001, *** = p < 0.0001. Pearson’s Product Moment Correlation.
