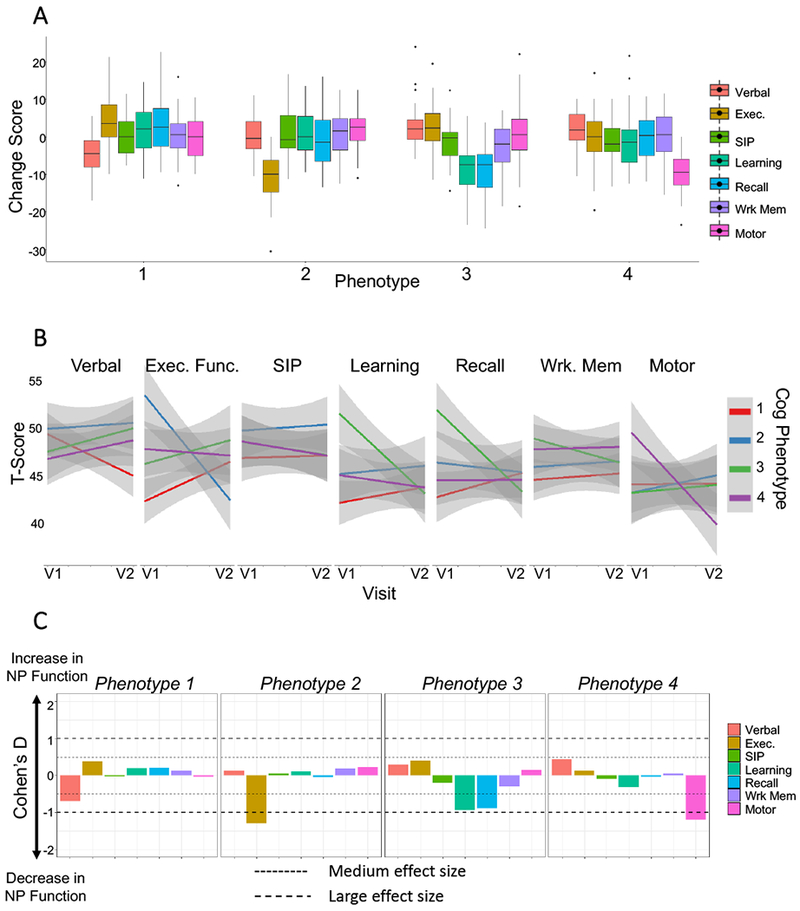
Figure 2:

Cognitive trajectory phenotypes. A) Boxplots representing the pattern of cognitive domain change scores for each of the indicated phenotypes. B) Line plots showing the average change in T-scores from visit 1 to visit 2 for each of the 4 cognitive phenotypes. The 95% confidence intervals are indicated by shaded areas. C) Effect size calculated for each cognitive domain stratified by cognitive phenotype.
