
Figure 1.
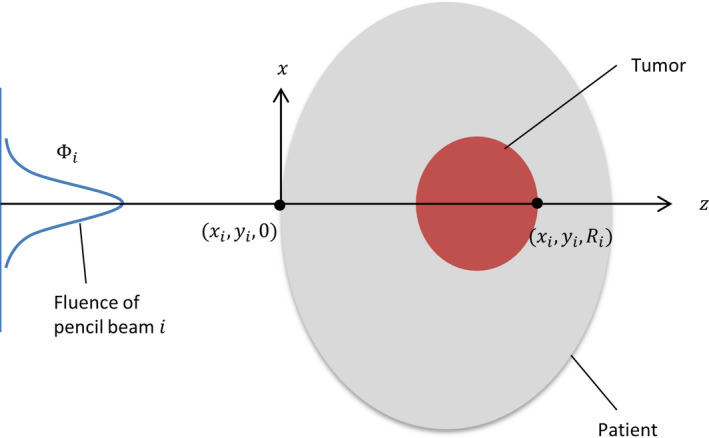
Diagram showing the coordinates used in heterogeneity index calculation for a specific pencil beam. [Color figure can be viewed at wileyonlinelibrary.com]
Official websites use .gov
A
.gov website belongs to an official
government organization in the United States.
Secure .gov websites use HTTPS
A lock (
) or https:// means you've safely
connected to the .gov website. Share sensitive
information only on official, secure websites.
Diagram showing the coordinates used in heterogeneity index calculation for a specific pencil beam. [Color figure can be viewed at wileyonlinelibrary.com]