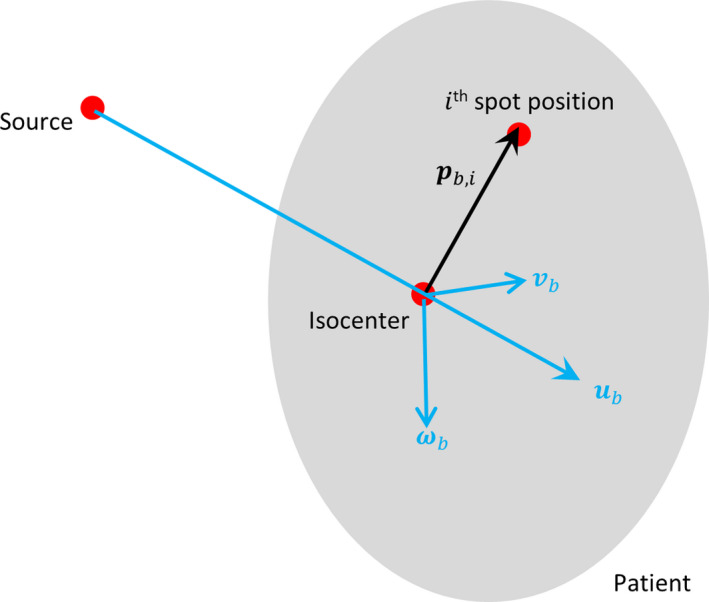
Figure 2.

Diagram showing the coordinates and the vectors used in spot sensitivity calculation. The beam divergence due to spot lateral distance to the isocenter is exaggerated for illustration purposes. The actual proton system source‐to‐axis distance is substantially greater than the target size and the individual pencil beams in the same beam direction are nearly parallel. [Color figure can be viewed at wileyonlinelibrary.com]
