
Figure 5.
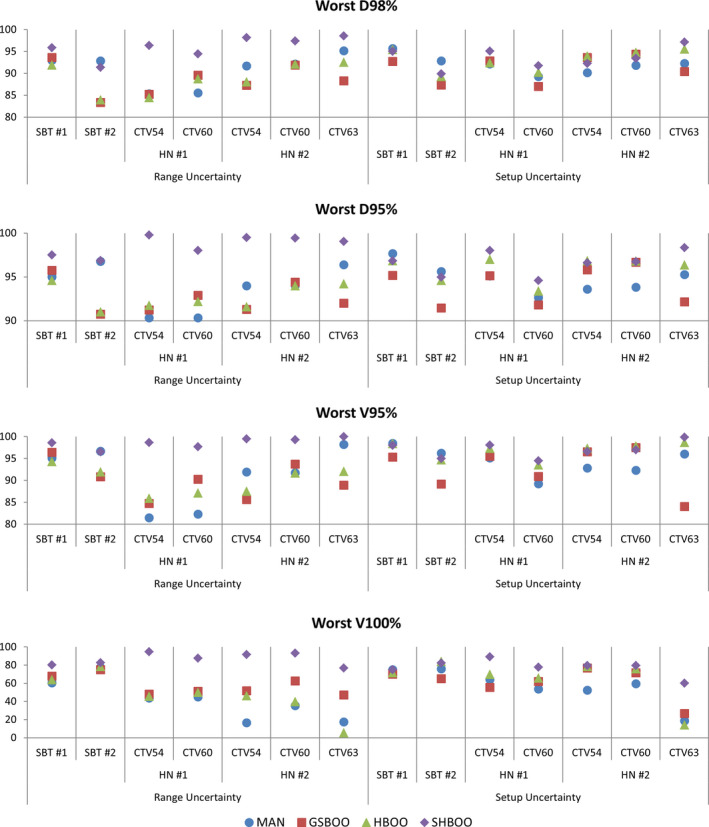
The comparison of worst D98% (top row), D95% (second row), V95% (third row), and V100% (bottom row) of the CTVs as a percentage of prescription doses, for every patient, between the plans with Conv FMO and MAN, GSBOO, HBOO and SHBOO beams, respectively. The situation with only range uncertainty is shown on the left and situation with only setup uncertainty is shown on the right in each plot. [Color figure can be viewed at wileyonlinelibrary.com]