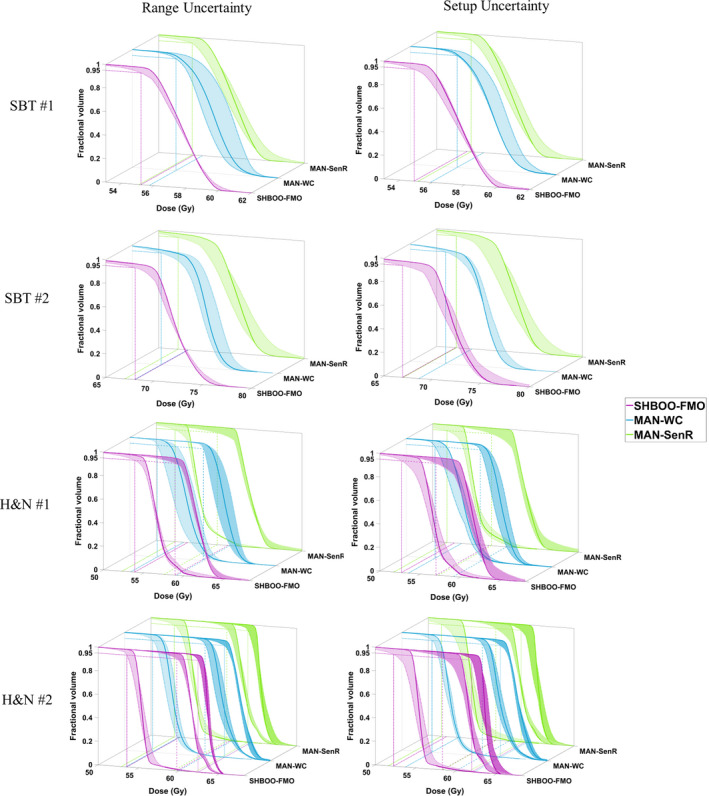
Figure 6.

CTV DVH bands of the four patients, indicating the robustness of the plans generated by SHBOO‐FMO, MAN‐WC and MAN‐SenR. Situation with only range uncertainty is shown on the left and situation with only setup uncertainty is shown on the right. The two CTVs in the H&N #1 patient are plotted together in the third row, and the three CTVs in the H&N #2 patient are plotted together in two figures in the fourth row. The worst D95% of each method is labeled by reference lines in the x‐y plane. [Color figure can be viewed at wileyonlinelibrary.com]
