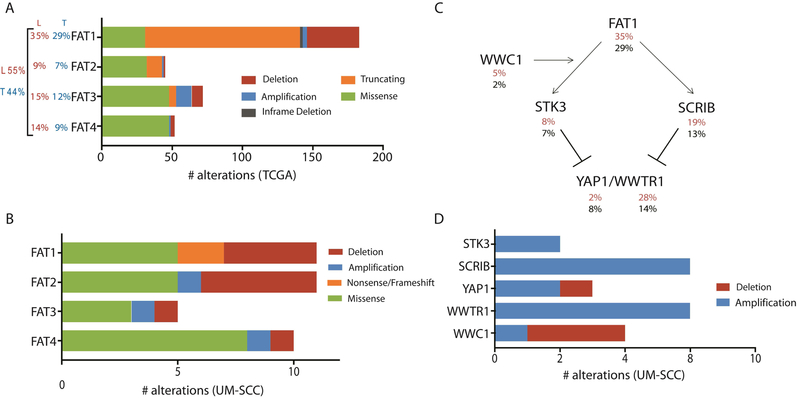
Figure 3. Summary of aberrations in FAT related genes in TCGA tumors and laryngeal UM-SCC cell lines.
(A) Alterations reported in TCGA provisional dataset (http://cbioportal.org; http://cancergenome.nih.gov/) for FAT1–4. Total numbers observed for each category of mutation or copy number variation are displayed. For each gene, the percentage of 510 tumors in the total HNSCC dataset with an alteration is reported to the left in black (T). The percentage of the 110 laryngeal primary tumors in this dataset harboring an alteration in each gene is reported in red (L). The percentage of all HNSCC (black) and laryngeal SCC (30) harboring one or more mutations in any FAT gene are reported in the far left. (B) Alterations identified in the laryngeal UM-SCC cell line panel for FAT1–4. This analysis considers available data for all 16 cell lines in this study, although exome sequencing was not performed for UM-SCC-57 or 81A, and copy number data is not available for UM-SCC-11A, 13, 41, or 76. (C) Schematic diagram describing proposed signaling interactions involving the FAT1 protein. Percentages of HNSCC tumors bearing alterations (amplifications, deletions, and mutations) in each gene are displayed below the gene name for LSCC only (30) and the overall cohort (black). (D) Alterations identified in the laryngeal UM-SCC cell line panel for Hippo/YAP1 pathway genes.

